The key to winning baseball games is pitching, fundamentals, and three run homers.
-- Earl Weaver
Josh Towers provided the pitching, throwing his first shutout as a Blue Jay and the second of his career. Alex Rios and Gregg Zaun hit the three-run homers. Zaun drove in five runs, Koskie and Hillenbrand also went deep... oh, it was brutal. And deeply, fundamentally satisfying.
All this and more, but they were talking about something else in both clubhouses after the game, as the good Dr Prison Fence reports in Battery powers Blue Jays to rout of O's.
Here's what John Gibbons thought of Daniel Cabrera throwing a 95 mph fastball towards Eric Hinske's head:
"I thought it was gutless."
As you can imagine, Hinske himself wasn't too pleased:
"It was a 2-0 pitch, and he threw a fastball right at my head. It definitely seemed like he tried to do it on purpose, which is why I was so upset... That's wrong. That's just wrong."
But they weren't too pleased in the other clubhouse, either. Cabrera had nothing to say, but manager Sam Perlozzo did:
"It certainly didn't look good. I'll talk to him later about that. It's not something that I like to see happen."
Catcher Sal Fasano was considerably more outspoken:
"He's going to learn the hard way because we're probably going to get somebody hurt tomorrow. And those guys are probably going to throw at somebody. And is it their fault? No. Whose fault is it?
It's unfortunate, but that's how baseball is played. And somebody on our team is probably going to get hit tomorrow."
Well, enough of that. I actually don't really expect Dave Bush to go head-hunting, although he's been known to hit the occasional batter in the head when that 65 mph curveball of his doesn't break. I seem to recall him hitting Miguel Tejada with one earlier this year.
Now I sure as hell wouldn't want to get hit anywhere by a baseball even at 65 mph, but major leaguers generally consider it beneath them to even rub the spot when that happens. So, on to other business.
The Rookie Rob mocks me, most recently under the guise of Edgar Allan Poe - see, if you haven't already, Tigers 9, Blue Jays 8: The Tell-Tale Table.
Yes, yes, he tasks me, and I shall have him, in the immortal words of Khan Noonian Singh. But let's face facts. I just can't help myself. And so here is a data table:
	        4/1   4/11  4/21  5/1   5/11  5/21  6/1   6/11  6/21  7/1  7/11  7/21  8/1
Adams	        9.76  2.67  2.29 11.53  0.51  6.00  3.03  2.61  7.88  7.13  6.36  8.81 12.55
Catalanotto	5.87  6.84  1.87  9.73  3.04 13.50 17.34  3.89  3.23  6.46 26.25  6.56  1.02
Hill		----  ----  ----  ---- 27.00 11.48  4.89 17.88  5.06  7.52  0.48  0.45  7.50
Hillenbrand	8.28 14.06  7.72  5.21  6.77  3.33  2.87 13.67  3.40  8.24  4.35  7.84  8.73
Hinske	       14.00  5.83  5.33  5.44  5.18  8.74  0.63  3.05  3.18  4.15  5.40  7.74  8.52
Hudson	        4.55  3.81  6.26  3.68  5.76  4.07  1.64  1.78  8.46 25.75  5.93  6.06  3.64
Johnson	        7.35  6.72  7.49  8.72  6.71  9.01  3.30  1.29  1.41 11.17  4.63  8.18  6.74
Koskie	        4.09  4.86  6.14  5.47  4.25  ----  ----  ----  ----  ----  ----  4.70  3.47
Rios	       15.90  2.41  9.74  2.40 13.03  2.35  3.82  6.86  6.74  2.67 12.35  3.26  8.83
Wells	        5.46  1.75  3.86  2.76  9.87  8.44 10.40  3.84 11.12  6.53 12.02  8.42  8.45
Zaun	        4.78 15.72  6.86  ----  3.67  5.79  2.19  3.23  9.57 10.99 15.68  1.24  4.71
What on earth, you're asking yourself, do all these numbers represent? Well, they are the Runs Created per 27 Outs of all the Jays major hitters, broken into 10 day chunks.
There has been discussion off and on, particularly centred on Orlando Hudson, of "streaky" hitters. Everybody says this about Hudson, and no one bothers to actually look into it. I wanted to, but I couldn't think of a sensible method. (But it was always clear to me that there needed to be context - you couldn't just look at Hudson, you would at least have to examine his teammates in the same fashion.)
I didn't want to just see how batting averages rose and fell every 10 days. I wanted to see what happened within the ten days. This way, I thought, we could see who was streaky, who was slump-prone, who was steady. I'm thinking a streaky hitter is someone who might .140 for two weeks and then suddenly hit .450 for two weeks. Someone who was slump-prone might be rolling along fairly steadily, but then fall into a long (longer than 10 days) prolonged funk, and then return to normal.
I wasn't going to use batting average as my single number to track. I would use the old standby, Runs Created. Seeing as how not everyone gets the same kind of playing time, I would use Runs Created Per 27 Outs used. (While OPS would be convenient, and probably show much the same thing, OPS offends my sense of logic.)
So I made that data table, that you have briefly glanced at, groaning about the Magpie and his rows of numbers. "Whoop-de-dam-doo", you're saying. I feel your pain.
But last week, Rob the Rook (showing off no doubt), dropped a few pretty graphs into one of his pieces, tracking a few batting averages over the course of the season. And EUREKA! quoth the Magpie - this is the tool I require. Even an old dog can learn new tricks.
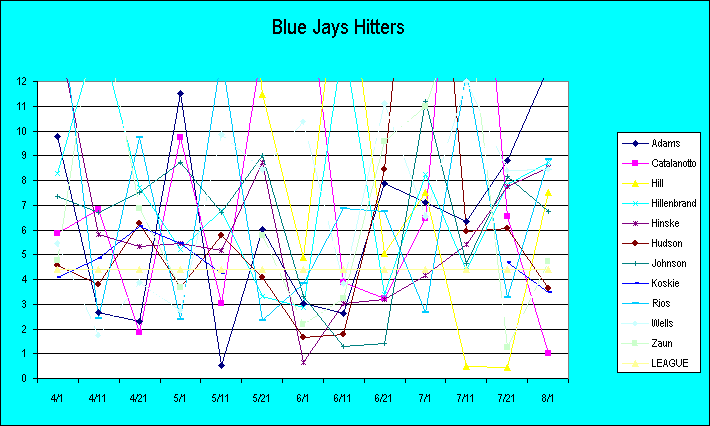
So this time I have more for you. I have provided a visual accompaniment to these dry and heartless numbers. Behold!

Well, that's confusing as all hell, isn't it? It will be much easier to look at everyone separately, no?
The average AL hitter has created 4.39 runs per 27 outs this year, which is the baseline you'll see running through each of these pretty pictures. We'll begin with Russ Adams:
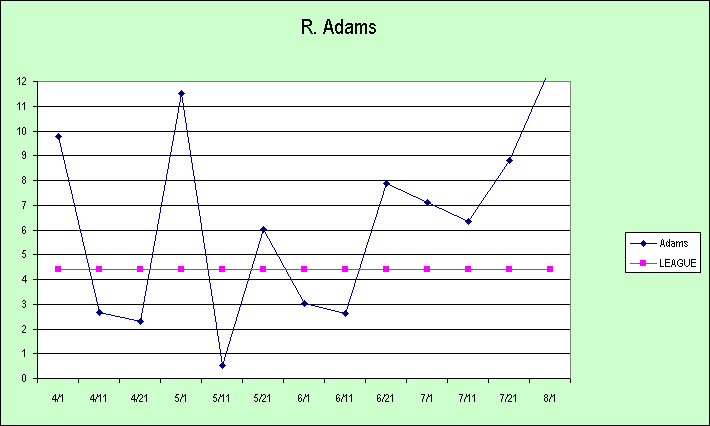
Adams, as you can see, was very much up and down through the two and a half months of the season, although the downs generally outnumbered the ups. Three productive periods appear like spikes in his chart - but since the middle of June, he's been going from strength to strength.
Here's the Cat:
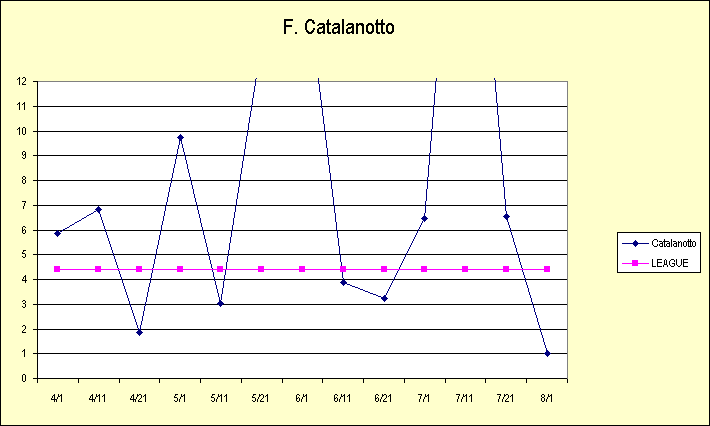
Now that looks like one streaky hitter, folks. He goes right through the roof in three of my 10 day periods (RC/27 of 13.5, 17.3, and 26.3. But it should be noted that in all three of those huge spikes he was playing considertably less than usual. Two of them overlap his absence on bereavement leave, and the other is during the All-Star Break. The sample size gets a little small on each occasion.
Next, we have the new kid on the block:
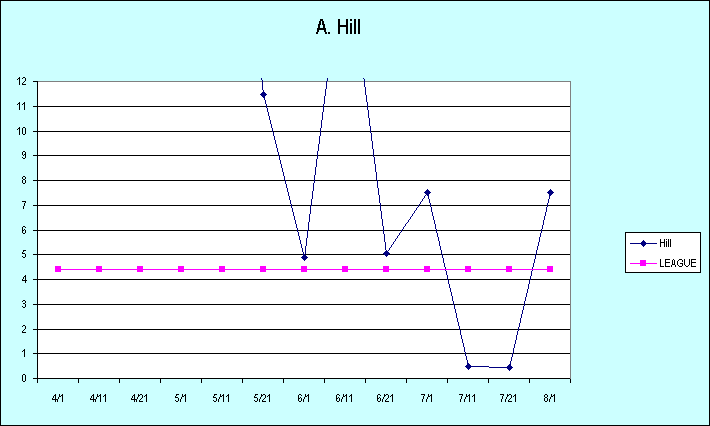
Among other things, this shows us what a real nasty slump looks like. Hill stopped hitting completely for a while there - he went 3-32 and 3-29 in the two periods beginning on July 11 and July 21 - and if you had nine guys in your lineup hitting like that, you'd probably get shut out more often than not. Imagine the other pitcher throwing a three-hitter every night. Basically, Hill was looking longingly at achieving the giddy and dizzying heights of Ken Huckaby-type production for three weeks. It's the worst stretch any of the regulars have had this year, by far.
Here is Aaron's new favourite player... have you collected the spoils yet? Enjoying the fruit of your winnings?
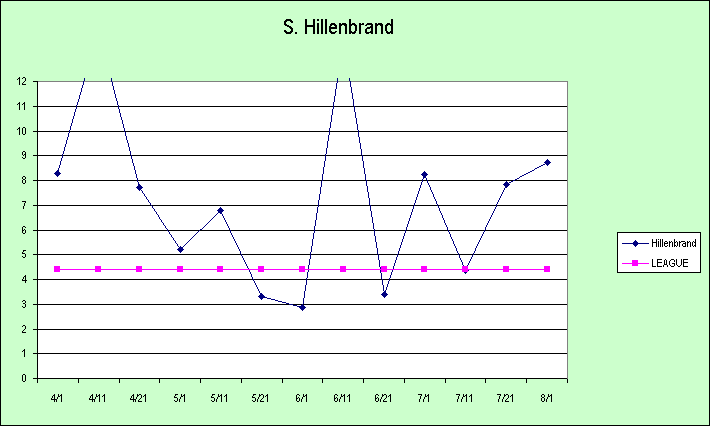
Shea has been fairly steady. He has a couple of major spikes, where he goes right through the roof - these are the April 11 and June 11 segments, when he got up to 14.1 and 13.7. Even his fallow periods have not been a total loss - he was able to contribute a little to the offense, if not always a whole lot.
OK. Time for the Dude.
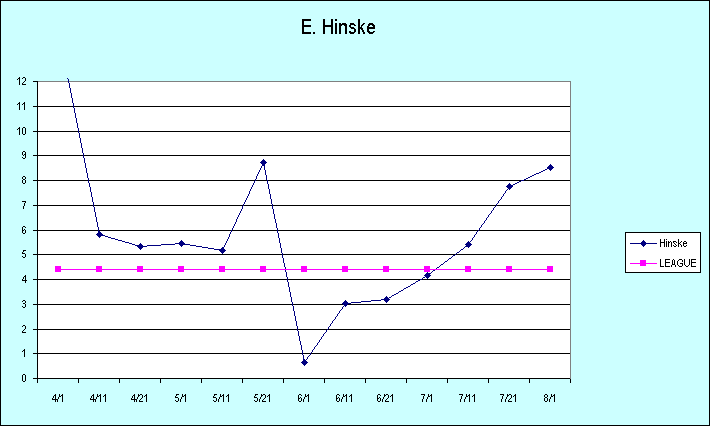
No one is going to believe me, but... For most of the season, Hinske has been a steady and a productive hitter. I know he's everybody's favourite whipping boy, and I think it's because when Hinske makes an out, he's usually flailing helplessly at a breaking ball, and cursing loudly as he storms back to the dugout. Whereas other guys are at least hitting fly balls, or popping out to an infielder, or grounding into double plays. (I know you all remember the GDP from the other night - but Hillenbrand, Johnson, Koskie, Rios, Hudson, Wells, and Catalanotto all hit into more double plays per plate appearance than Hinske.)
However, like Aaron Hill so far in his very short career, Hinske appears to be vulnerable to the prolonged slump. And his slumps, off the evidence of this season, can be real doozies. (That's a technical term, don't worry about it.) At the beginning of June, Hinske suddenly started hitting like a pitcher, and it took him more than a month to get himself straightened out. June happened, and it counts - but when you take it out of his numbers, Hinske is hitting .283, .357, .471.
Next is the guy that everybody describes as a streaky hitter, the O-Dog himself:
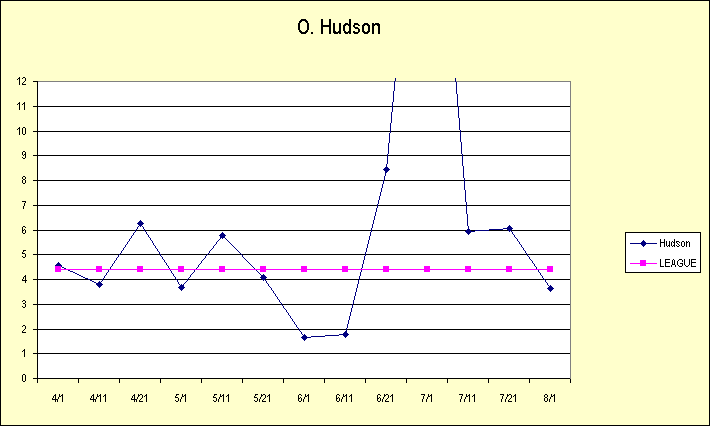
Actually, Hudson's been a fair bit like Hinske. He's generally been fairly productive most of the time, although at a somewhat lower level than Hinske - Hudson doesn't hit for as many extra bases and he doesn't draw nearly as many walks. Also like Hinske, the O-Dog stopped hitting at the beginning of June. He was coming out of it when he tweaked his hamstring just before the All Star Break - that huge spike where his RC/27 skied to 25.8 covers just 15 at bats. Since the break, he's returned to normal. Generally steady and productive, with fairly normal ups and downs.
Reed Johnson plays on energy and enthusiasm, hustle and adrenaline. When it runs down, his production bottoms out.
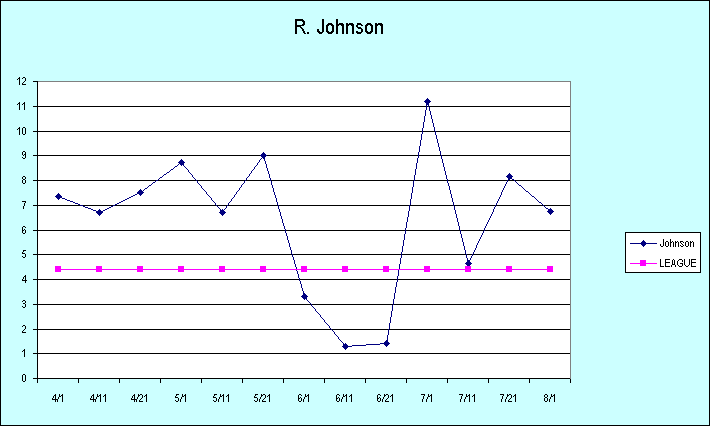
After playing a lot, and playing very well, over the first two months, Johnson started to sag in June. The most at bats Johnson had over any 10 day period was in the segment beginning on May 21. Johnson played well over those ten days, but stopped hitting almost completely immediately afterward. But after his workload was reduced (Sparky batted just 16 times in the 10 day period begininng on June 21) - PRESTO! He was restored! And the Boston Red Sox were the guys that found out about it first...
The Anola Guy has spent much of the season on the DL, but here's his chart anyway:
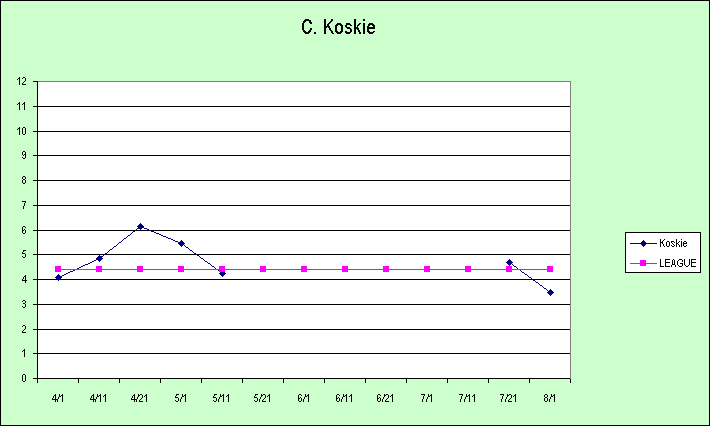
This is interesting to me because his production has so far stayed within shouting distance of the league average baseline. Koskie has historically been a player who can get very very hot, one way or another - last year he was hitting his home runs in bunches, the year before he hit .408 in one month, and the year before that he had two different months when he hit better than .350. I think he's very close to starting one of those runs right about now.
Next - well, his name is Rios, and he dances on the sand:
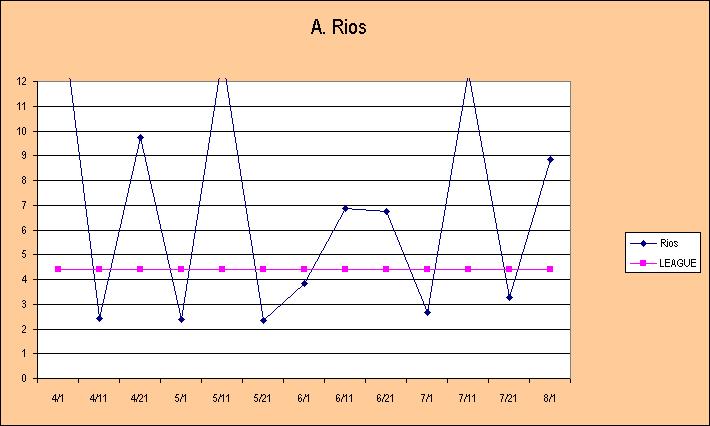
Now that, ladies and gentlemen, is a streaky hitter. That is what it looks like. We have located and identified the species. Everything in Rios' line is either a peak or a valley. There's no prolonged rut, like what happened to Hinske, or Hudson, or Hill. Rios is up one week, down the next, up the next. But all this come with a big so far - like Hill and Adams, Rios is still a developing hitter. And in some ways, he may be even more of a work in progress than Hill or Adams, who strike me as having already more or less defined what type of offensive players they're going to be. Well, at least more than Rios has, anyway.
Vernon Wells. The best hitter on the team, OK? No argument accepted.
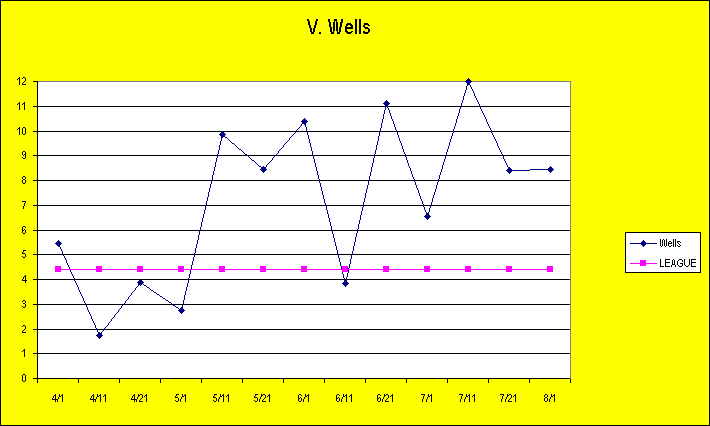
We all know about Vernon's season. He didn't do much in April, as usual, and since then he's been super. Basically, since the first of May, he has been consistently hitting the crap out of the ball. Even his worst period is pretty decent.
And finally, Going Going...
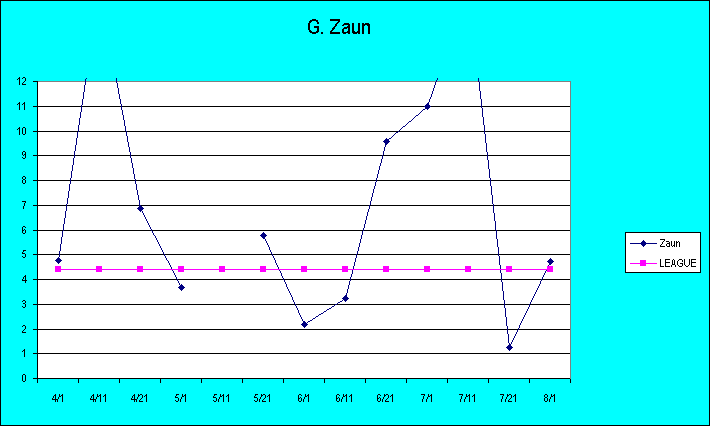
Zaun has been a streaky offensive player as well. The rhythm of it is not nearly as radical as what we see from Rios, but the basic pattern is quite similar. Great big peaks, and pretty deep valleys - it's just that in Zaun's case, both the peaks and valleys last a bit longer than they do for Rios.
I left out the bench guys, because the sample sizes over 10 day periods just get way too small. The highest RC/27 figure posted over a 10 day period by any Blue Jay was actually posted by Frank Menechino over the 10 days beginning on June 10. Mouse was creating runs at the rate of 274.6 per game. That's right. If you had nine guys in your lineup hitting like Menechino did during that period, you'd score 275 runs in a game.
You're all wondering what the hell Menechino did from June 11 to June 20, aren't you?
He batted .800, which will keep the innings going and going for quite some time. His OBP was .900, and his slugging perentage - 2.000. Yes, he went 4-5, with 2 home runs, was hit by a pitch, and drew 4 bases on balls. He reached base in 9 of 10 plate appearances, and had 10 total bases in his five at bats.
Now that's bench production!
Anyway, it seems fairly clear to me that the streakiest hitters on the team this year have been Rios, especially, and Zaun. The steadiest have been Wells and Hillenbrand. The guys who have run into extended slumps have been Hinske, Hill, and Hudson.
My work is done.
https://www.battersbox.ca/article.php?story=20050812161809662