No one ever talks about the Sixth Man.
Well, they don't. In the springtime, no one ever worries about a team's sixth starting pitcher. Never mind the seventh.
Maybe we should. Because your five starters are not going to start 162 games. It happens every few years, to one team, but that's about it.
You are going to need more than five starters to get through the season. Get used to it.
By some strange coincidence, the two teams that sent their Top 5 starters to the hill the most often this past season both played in Chicago. The White Sox got 150 starts out of their top five guys - the Cubs got 152. The Cubs needed the sixth man just 10 times in 2007.
Ten starts - that's still having someone else in the rotation for about two months of the season. And these were the teams at the far end of the discussion. Most teams end up sending their sixth (and seventh, and eighth) man to the hill as often as they send their best guy. Some teams much, much more often.
A word on method. I am defining the Sixth Man by how it all shook out in the end, not by what the team's plans may have been as the calendar turned from March to April. The Top 5 starters, for every team, are the five men who started the most games. In the case of the Blue Jays, that includes Shaun Marcum, who began the season in the bullpen. And it includes Dustin McGowan and Jesse Litsch, who began the season in the minors. Gustavo Chacin, who was injured, Tomo Ohka, who was released, and Josh Towers, who was sent to a corner, were all part of the rotation when the year began. They became Sixth Men. They evolved. Or de-evolved, as the case may be.
So how often did each team need to go beyond the five men who started the most games, and who got the call?
Washington 59 - Simontacchi 13, Hanrahan 11, Bowie 8, Patterson 7, Williams 6, Lannan 6, Speigner 6, Traber 2
Texas 44 - Wright 9, Gabbard 8, Rheinecker 7, Volquez 6, Wood 4, Mendoza 3, Murray 2, Koronka 2, Eyre 2, Galarraga 1
LA Dodgers 44 - Hendrickson 15, Wells 7, Kuo 6, Schmidt 6, Stultz 5, Loaiza 5
Colorado 41 - Lopez 14, Morales 8, Buchholz 8, Dessens 5, Redman 3, Kim 1, Bautista 1, Harikkala 1
NY Yankees 41 - Igawa 12, Rasner 6, Clippard 6, DeSalvo 6, Kennedy 3, Karstens 3, Pavano 2, Wright 2, Henn 1
Detroit 40 - Miller 13, Rogers 11, Jurrjens 7, Tata 3, Vasquez 3, Bazardo 2, Miner 1
Philadelphia 39 - Garcia 11, Lohse 11, Durbin 10, Myers 3, Ennis 1, Castro 1, Segovia 1, Happ 1
Kansas City 38 - Davies 11, Elarton 9, Nunez 6, Buckner 5, Duckworth 3, Thomson 2, Hochevar 1, Hudson 1
St. Louis 37 - Pineiro 11, Wellemeyer 11, Maroth 7, Mulder 3, Keisler 3, Carpenter 1, Percival 1
Pittsburgh 35 - Morris 11, Van Benschoten 9, Youman 8, Chacon 4, Bullington 3
Toronto 34 - Towers 15, Ohka 10, Chacin 5, Zambrano 2, Taubenheim 1, Banks 1
Cincinnati 33 - Bailey 9, Milton 6, Dumatrait 6, Shearn 6, Ramirez 3, Saarloos 3
Baltimore 32 - Olson 7, Loewen 6, Leicester 5, Liz 4, Wright 3, Santos 3, Birkins 2, Zambrano 2
Houston 31 - Albers 18, Backe 5, Paulino 3, Gutierrez 3, Patton 2
Florida 31 - Obermuller 7, Sanchez 6, Barone 6, Seddon 4, Johnson 4, Nolasco 4
Tampa Bay 30 - Fossum 10, Howell 10, Seo 10
NY Mets 29 - Pelfrey 13, Lawrence 6, Martinez 5, Vargas 2, Park 1, Williams 1, Humber 1
Atlanta 29 - Reyes 10, Cormier 9, Redman 5, Lerew 3, Bennett 2
Minnesota 28 - Slowey 11, Ortiz 10, Ponson 7
LA Angels 27 - Colon 18, Moseley 8, Carrasco 1
San Francisco 26 - Correia 8, Ortiz 8, Mirsch 4, Sanchez 4, Blackley 2
Milwaukee 25 - Gallardo 17, Villanueva 6, Parra 2
Cleveland 24 - Sowers 13, Laffey 9, Stanford 2
Oakland 24 - Braden 14, Harden 4, Meyer 3, Loaiza 2, Lewis 1
Arizona 23 - Johnson 10, Petit 10, Kim 2, Eveland 1
Boston 22 - Lester 11, Gabbard 7, Buchholz 3, Hansack 1
Seattle 21 - Baek 12, Feirabend 9
San Diego 20 - Hensley 9, Tomko 4, Cassel 4, Stauffer 2, Ledezma 1
Chicago White Sox 12 - Floyd 10, Broadway 1, Masset 1
Chicago Cubs 10 - Trachsel 4, Guzman 3, Miller 3
The tie-breaker used, when deciding who was the fifth man and who was the sixth, was innings pitched. Hence Maroth over Miller (Detroit), Tomko over Hendrickson (Dodgers), Saunders over Colon (Angels), and Jennings over Albers (Houston).
Some familiar names in there, generally pitchers who would have been counted on to be part of the Top 5 but missed large parts of the season because of injury (Randy Johnson, Kenny Rogers, Jason Schmidt, Bartolo Colon).
In view of how much work these guys do, it matters how well they do it. And so - a Data Table!
GS W L IP H ER R HR BB SO K/9 WHIP ERAAnother thing we could examine is the drop-off between a team's Top 5 starters and the guys filling in. So let's make a more extensive Data Table, and this time we'll rank them by the size of the drop off. There ought to be a drop, after all - the Top 5 starters are supposed to be better than the other guys, right? That's why they're starting more games.
MIL 25 11 6 145 134 54 58 12 57 124 7.70 1.32 3.35
BOS 22 10 2 125.2 108 56 60 15 58 98 7.02 1.32 4.01
CWS 12 3 5 69 77 34 37 12 20 55 7.17 1.41 4.43
COL 41 11 11 204 226 113 121 25 61 125 5.51 1.41 4.99
ARI 23 6 8 113 120 64 69 20 35 112 8.92 1.37 5.10
DET 40 13 13 200.1 213 114 123 27 93 129 5.80 1.53 5.12
SFG 26 5 9 134 156 77 79 16 47 98 6.58 1.51 5.17
HOU 31 8 16 164.1 180 99 106 27 60 96 5.26 1.46 5.42
TEX 44 10 11 222.1 247 135 145 35 119 133 5.38 1.65 5.46
STL 37 9 13 176.1 212 109 124 33 61 105 5.36 1.55 5.56
CLE 24 6 9 129.1 150 80 82 13 34 59 4.11 1.42 5.57
MIN 28 9 10 154.2 195 96 103 30 37 88 5.12 1.50 5.59
LAA 27 7 10 142.1 182 90 96 16 45 103 6.51 1.59 5.69
NYY 41 9 12 189.1 215 123 131 37 98 115 5.47 1.65 5.85
PHA 39 9 13 197.1 232 129 135 34 84 154 7.02 1.60 5.88
TOR 34 8 16 184.1 225 123 133 37 57 96 4.69 1.53 6.01
LAD 44 11 23 216.2 264 150 159 32 81 157 6.52 1.59 6.23
FLA 31 5 14 143 203 102 118 22 75 80 5.03 1.94 6.42
WAS 59 18 28 285.2 349 206 214 46 149 165 5.20 1.74 6.49
NYM 29 7 14 148 195 107 112 18 66 103 6.26 1.76 6.51
KCR 38 9 20 174 217 129 139 34 83 100 5.17 1.72 6.67
OAK 24 3 13 115 141 86 94 14 45 81 6.34 1.62 6.73
PGH 35 6 20 171 214 132 137 15 84 92 4.84 1.74 6.95
ATL 29 5 15 135.2 165 106 113 35 65 86 5.71 1.70 7.03
CIN 33 7 14 149 185 117 123 27 73 82 4.95 1.73 7.07
SEA 21 5 9 108 146 85 88 15 32 67 5.58 1.65 7.08
SDP 20 5 6 93.2 125 75 78 14 45 63 6.05 1.81 7.21
CHI 10 1 4 46.1 66 38 38 9 18 30 5.83 1.81 7.38
BAL 32 5 14 135 171 116 121 17 98 95 6.33 1.99 7.73
TAM 30 7 15 152.1 221 133 146 29 53 105 6.20 1.80 7.86
GS W L IP H ER R HR BB SO K/9 IP/GS WHIP ERA Drop-offAs you can quite clearly see, Milwaukee got much better work from their extra starters than they did from the top five guys. Uh, Ned Yost? What the hell? You got explaining to do, man...
Top 5 MIL 137 49 41 788 886 418 442 99 250 573 6.54 5.75 1.44 4.77
Sixth Men MIL 25 11 6 145 134 54 58 12 57 124 7.70 5.80 1.32 3.35 -1.42
Brewers MIL 162 60 47 933 1020 472 500 111 307 697 6.72 5.76 1.42 4.55
Top 5 BOS 140 67 50 866 871 408 425 97 252 674 7.00 6.19 1.30 4.24
Sixth Men BOS 22 10 2 125.2 108 56 60 15 58 98 7.02 5.71 1.32 4.01 -0.23
Red Sox BOS 162 77 52 991.2 979 464 485 112 310 772 7.01 6.12 1.30 4.21
Top 5 TEX 118 32 54 615.2 729 377 428 73 279 394 5.76 5.22 1.64 5.51
Sixth Men TEX 44 10 11 222.1 247 135 145 35 119 133 5.38 5.05 1.65 5.46 -0.05
Rangers TEX 162 42 65 838 976 512 573 108 398 527 5.66 5.17 1.64 5.50
Top 5 CWS 150 50 60 947 1009 471 520 119 267 642 6.10 6.31 1.35 4.48
Sixth Men CWS 12 3 5 69 77 34 37 12 20 55 7.17 5.75 1.41 4.43 -0.04
White Sox CWS 162 53 65 1016 1086 505 557 131 287 697 6.17 6.27 1.35 4.47
Top 5 COL 122 44 36 739.1 777 367 398 91 251 462 5.62 6.06 1.39 4.47
Sixth Men COL 41 11 11 204 226 113 121 25 61 125 5.51 4.98 1.41 4.99 0.52
Rockies COL 163 55 47 943.1 1003 480 519 116 312 587 5.60 5.79 1.39 4.58
Top 5 DET 122 49 37 731.2 778 371 396 97 249 524 6.45 6.00 1.40 4.56
Sixth Men DET 40 13 13 200.1 213 114 123 27 93 129 5.80 5.01 1.53 5.12 0.56
Tigers DET 162 62 50 932 991 485 519 124 342 653 6.31 5.75 1.43 4.68
Top 5 STL 125 39 59 712.2 775 389 426 82 260 427 5.39 5.70 1.45 4.91
Sixth Men STL 37 9 13 176.1 212 109 124 33 61 105 5.36 4.77 1.55 5.56 0.65
Cardinals STL 162 48 72 889 987 498 550 115 321 532 5.39 5.49 1.47 5.04
Top 5 HOU 131 40 52 793.1 856 402 424 108 234 528 5.99 6.06 1.37 4.56
Sixth Men HOU 31 8 16 164.1 180 99 106 27 60 96 5.26 5.30 1.46 5.42 0.86
Astros HOU 162 48 68 957.2 1036 501 530 135 294 624 5.86 5.91 1.39 4.71
Top 5 ARI 139 54 45 845 877 386 420 98 314 571 6.08 6.08 1.41 4.11
Sixth Men ARI 23 6 8 113 120 64 69 20 35 112 8.92 4.91 1.37 5.10 0.99
D'backs ARI 162 60 53 958 997 450 489 118 349 683 6.42 5.91 1.41 4.23
Top 5 FLA 131 37 49 714 843 429 482 97 320 536 6.76 5.45 1.63 5.41
Sixth Men FLA 31 5 14 143 203 102 118 22 75 80 5.03 4.61 1.94 6.42 1.01
Marlins FLA 162 42 63 857 1046 531 600 119 395 616 6.47 5.29 1.68 5.58
Top 5 SFG 136 46 49 834.2 794 379 414 74 353 604 6.51 6.14 1.37 4.09
Sixth Men SFG 26 5 9 134 156 77 79 16 47 98 6.58 5.15 1.51 5.17 1.08
Giants SFG 162 51 58 968.2 950 456 493 90 400 702 6.52 5.98 1.39 4.24
Top 5 PHA 123 52 37 741 793 383 401 107 225 510 6.19 6.02 1.37 4.65
Sixth Men PHA 39 9 13 197.1 232 129 135 34 84 154 7.02 5.06 1.60 5.88 1.23
Phillies PHA 162 61 50 938.1 1025 512 536 141 309 664 6.37 5.79 1.42 4.91
Top 5 MIN 134 50 55 812.2 856 369 403 100 212 622 6.89 6.06 1.31 4.09
Sixth Men MIN 28 9 10 154.2 195 96 103 30 37 88 5.12 5.52 1.50 5.59 1.50
Twins MIN 162 59 65 967.1 1051 465 506 130 249 710 6.61 5.97 1.34 4.33
Top 5 CLE 138 64 40 892 940 395 427 92 216 587 5.92 6.46 1.30 3.99
Sixth Men CLE 24 6 9 129.1 150 80 82 13 34 59 4.11 5.39 1.42 5.57 1.58
Indians CLE 162 70 49 1021.1 1090 475 509 105 250 646 5.69 6.30 1.31 4.19
Top 5 NYY 121 56 35 731.2 780 345 368 56 220 459 5.65 6.05 1.37 4.24
Sixth Men NYY 41 9 12 189.1 215 123 131 37 98 115 5.47 4.62 1.65 5.85 1.60
Yankees NYY 162 65 47 921 995 468 499 93 318 574 5.61 5.69 1.43 4.57
Top 5 LAA 135 65 42 834 882 368 402 83 253 642 6.93 6.18 1.36 3.97
Sixth Men LAA 27 7 10 142.1 182 90 96 16 45 103 6.51 5.27 1.59 5.69 1.72
Angels LAA 162 72 52 976.1 1064 458 498 99 298 745 6.87 6.03 1.40 4.22
Top 5 WAS 103 25 34 570.1 588 280 303 88 205 333 5.25 5.54 1.39 4.42
Sixth Men WAS 59 18 28 285.2 349 206 214 46 149 165 5.20 4.84 1.74 6.49 2.07
Nationals WAS 162 43 62 856 937 486 517 134 354 498 5.24 5.28 1.51 5.11
Top 5 TOR 128 56 38 814.1 757 348 376 89 254 609 6.73 6.36 1.24 3.85
Sixth Men TOR 34 8 16 184.1 225 123 133 37 57 96 4.69 5.14 1.53 6.01 2.16
Blue Jays TOR 162 64 54 998.2 982 471 509 126 311 705 6.35 6.16 1.29 4.24
Top 5 SEA 141 54 53 820.2 947 447 482 97 282 531 5.82 5.82 1.50 4.90
Sixth Men SEA 21 5 9 108 146 85 88 15 32 67 5.58 5.14 1.65 7.08 2.18
Mariners SEA 162 59 62 928.2 1093 532 570 112 314 598 5.80 5.73 1.52 5.16
Top 5 KCR 124 40 50 713.1 786 352 378 79 227 427 5.39 5.75 1.42 4.44
Sixth Men KCR 38 9 20 174 217 129 139 34 83 100 5.17 4.58 1.72 6.67 2.23
Royals KCR 162 49 70 887.1 1003 481 517 113 310 527 5.35 5.48 1.48 4.88
Top 5 LAD 118 47 38 700.1 694 301 330 62 258 528 6.79 5.94 1.36 3.87
Sixth Men LAD 44 11 23 216.2 264 150 159 32 81 157 6.52 4.92 1.59 6.23 2.36
Dodgers LAD 162 58 61 917 958 451 489 94 339 685 6.72 5.66 1.41 4.43
Top 5 PGH 127 40 50 762 871 388 418 88 242 509 6.01 6.00 1.46 4.58
Sixth Men PGH 35 6 20 171 214 132 137 15 84 92 4.84 4.89 1.74 6.95 2.36
Pirates PGH 162 46 70 933 1085 520 555 103 326 601 5.80 5.76 1.51 5.02
Top 5 NYM 133 59 39 792.2 723 353 388 99 307 613 6.96 5.96 1.30 4.01
Sixth Men NYM 29 7 14 148 195 107 112 18 66 103 6.26 5.10 1.76 6.51 2.50
Mets NYM 162 66 53 940.2 918 460 500 117 373 716 6.85 5.81 1.37 4.40
Top 5 CIN 129 42 45 808 877 400 431 106 199 606 6.75 6.26 1.33 4.46
Sixth Men CIN 33 7 14 149 185 117 123 27 73 82 4.95 4.52 1.73 7.07 2.61
Reds CIN 162 49 59 957 1062 517 554 133 272 688 6.47 5.91 1.39 4.86
Top 5 OAK 138 49 47 838 860 368 414 81 280 560 6.01 6.07 1.36 3.95
Sixth Men OAK 24 3 13 115 141 86 94 14 45 81 6.34 4.79 1.62 6.73 2.78
Athletics OAK 162 52 60 953 1001 454 508 95 325 641 6.05 5.88 1.39 4.29
Top 5 ATL 133 53 43 781.1 788 347 370 91 234 576 6.63 5.87 1.31 4.00
Sixth Men ATL 29 5 15 135.2 165 106 113 35 65 86 5.71 4.68 1.70 7.03 3.03
Braves ATL 162 58 58 917 953 453 483 126 299 662 6.50 5.66 1.37 4.45
Top 5 TAM 132 38 47 780.1 823 406 438 93 265 694 8.00 5.91 1.39 4.68
Sixth Men TAM 30 7 15 152.1 221 133 146 29 53 105 6.20 5.08 1.80 7.86 3.18
Devil Rays TAM 162 45 62 932.2 1044 539 584 122 318 799 7.71 5.76 1.46 5.20
Top 5 CHI 152 63 46 909.1 829 407 439 113 327 705 6.98 5.98 1.27 4.03
Sixth Men CHI 10 1 4 46.1 66 38 38 9 18 30 5.83 4.63 1.81 7.38 3.35
Cubs CHI 162 64 50 955.2 895 445 477 122 345 735 6.92 5.90 1.30 4.19
Top 5 BAL 130 40 44 779 753 378 397 92 319 611 7.06 5.99 1.38 4.37
Sixth Men BAL 32 5 14 135 171 116 121 17 98 95 6.33 4.22 1.99 7.73 3.37
Orioles BAL 162 45 58 914 924 494 518 109 417 706 6.95 5.64 1.47 4.86
Top 5 SDP 143 54 43 841.1 791 352 367 68 236 647 6.92 5.88 1.22 3.77
Sixth Men SDP 20 5 6 93.2 125 75 78 14 45 63 6.05 4.68 1.81 7.21 3.44
Padres SDP 163 59 49 935 916 427 445 82 281 710 6.83 5.74 1.28 4.11
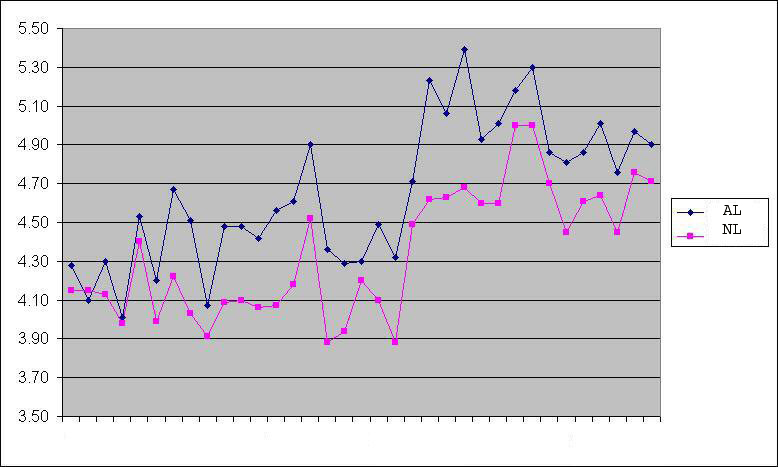
Year      AL      NL    DIFF
1973    4.28    4.15    0.13
1974    4.10    4.15   -0.05
1975    4.30    4.13    0.17
1976    4.01    3.98    0.03
1977    4.53    4.40    0.13
1978    4.20    3.99    0.21
1979    4.67    4.22    0.45
1980    4.51    4.03    0.48
1981    4.07    3.91    0.16
1982    4.48    4.09    0.39
1983    4.48    4.10    0.38
1984    4.42    4.06    0.36
1985    4.56    4.07    0.49
1986    4.61    4.18    0.43
1987    4.90    4.52    0.38
1988    4.36    3.88    0.48
1989    4.29    3.94    0.35
1990    4.30    4.20    0.10
1991    4.49    4.10    0.39
1992    4.32    3.88    0.44
1993    4.71    4.49    0.22
1994    5.23    4.62    0.61
1995    5.06    4.63    0.43
1996    5.39    4.68    0.71
1997    4.93    4.60    0.33
1998    5.01    4.60    0.41
1999    5.18    5.00    0.18
2000    5.30    5.00    0.30
2001    4.86    4.70    0.16
2002    4.81    4.45    0.36
2003    4.86    4.61    0.25
2004    5.01    4.64    0.37
2005    4.76    4.45    0.31
2006    4.97    4.76    0.21
2007    4.90    4.71    0.19
https://www.battersbox.ca/article.php?story=20071007135559557