I don't want to just include a link and say go check this out - nor would it be right if I simply retype what he typed. The least I can do is present you with one of my pretty pictures. Here is how the Blue Jays payroll compares with that of the Yankees, since 1992. The Yankees payroll is the solid light blue line - the other line shows you how the Blue Jays payroll relates to the New York baseline:
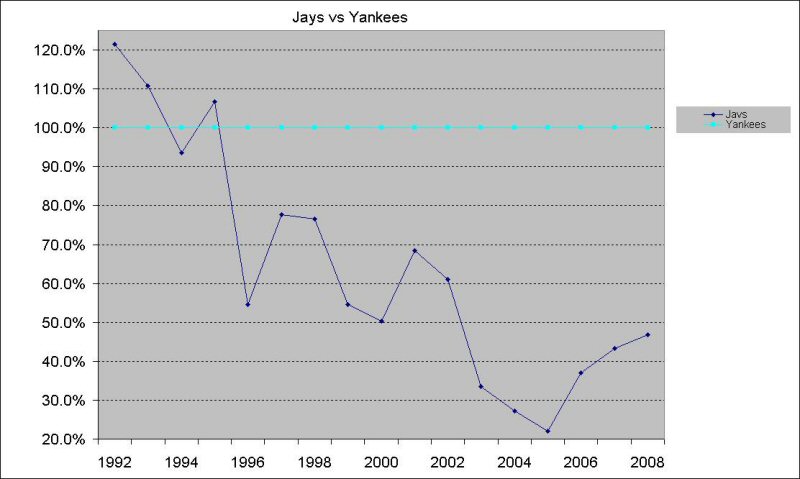
There's knowing something, and then there's knowing something. I knew that during the championship years the Jays were spending as much money as the Yankees, sometimes more. I knew those days were long gone. But it's still something altogether different to actually look at those numbers in a row: from 108% in 1992 all the way down to just under 22% in 2005.
Which raises this question. I don't know whether J.P. Ricciardi actually said in November 2001 that he could compete with the Yankees on $50 million a year or whether that's just some Urban Legend. But even if he did say it, so what? In 2001, the Yankees payroll was $112 million. They had just become the first team to crack the $100 million dollar ceiling. That was where Ricciardi's target stood. But less than four years later, the Yankees had almost doubled that previously unprecedented figure.
This has always seemed obvious to me, but it still seems to require being pointed out. We'll never know if Ricciardi could have competed with them at $50 million per year, but clearly any plans he may or may not have had to do so were no longer worth the paper they may or may not have been scribbled down upon. Because the Yankees didn't stand still. They continued, and still continue, to push the limits of how much money you could actually spend on baseball players. (Not anticipating that may have actually been Ricciardi's biggest error. It seems not to have occurred to him that he was chasing a moving target.)
Anyway, I thought all of this was very striking, and so also was something else Will put together. A 1992 dollar is the same as a 2007 dollar in name only. What happens if you convert all currency figures to a constant? You get a very different view of the Blue Jays payroll over the years. Will has some very interesting things to say about this - first he shows that in constant dollars that Blue Jays payroll has been fairly steady over the years - there's a blip in 2001 and 2002, when Ash frantically threw a lot of money around and Ricciardi was called in to cut it back.
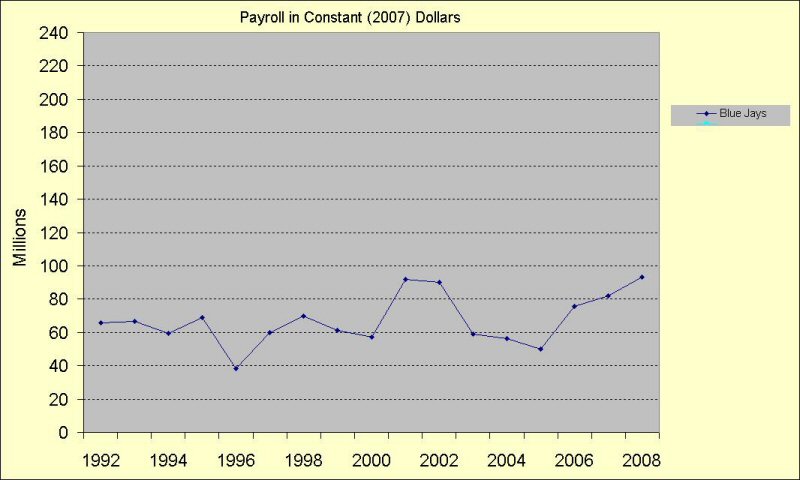
But Will makes the interesting and absolutely crucial point that inflation runs at a much higher pace in the world of baseball than it does in the rest of the world. The Blue Jays spent $43.7 million in 1992. In dollar terms, that would be like spending $65.7 million in 2007. Well hang on - the Blue Jays actually spent $81.9 million in 2007, and they're spending about $97.8 million this year (which is about $93.1 million in 2007 dollars, just for the sake of using the same base-line.)
So what's the problem?
Baseball inflation. A million dollars doesn't buy what it used to anywhere, but in the world of baseball it buys far, far less than it used to. Will cites the average 1992 salary as $1.08 million. This year, it's $2.74 million. The 2007 dollar may be 138% of the 1992 dollar, but the cost of major league talent in 2008 is 256% of what it was in 1992.
Context is everything.
It takes a much braver man than I to actually come out and defend J.P. Ricciardi these days, especially in this Summer of Our Discontent. But context is everything. Speaking of which, the actual context for Will's piece seems to be a comparison of the resources Ash and Ricciardi had to work with. Will, who seems to be responding to feedback on an earlier piece I've either been unable to either find or just identify, contents himself with this:
If JP has done an average job, and produced an average team, he's done so with average money.
And finally - something for me to do! After all - most of this piece amounts to little more than summarizing the excellent work Will has done, and exhorting you to go over and see it for yourselves. And once more, I exhort you! But here's my thought - if Ricciardi's done an average job with average money, might there be someone out there who's done better than that? So let's not look at just the Yankees and Blue Jays - let's check out the entire American League. (Hey Will - you think you've got too much time on your hands? It is I, the Magpie, the one with No Life Whatsoever!)
Because I know what you're thinking - yes, there is someone who's done better than that and Ricciardi used to work for him.
Let me also provide a quick note on the Method, such as it is, behind these pretty pictures. The yellow line is the average American League payroll on all three charts. I know it says MLB average on two of them, but it's not - its AL verage for all three. I was thinking that it's not tremendously relevant to the Blue Jays how much the Mets or Dodgers are spending - they don't compete with them for much of anything. (Although they do compete with the NL teams for talent in the off-season, so it's not completely irrelevant. Whatever - these are all AL averages anyway! Derived at by adding up the 14 AL payrolls and dividing by 14, although I didn't bother actually showing a line for the Milwaukee Brewers from 1992-97.)
Anyway, here is the AL East through the years:
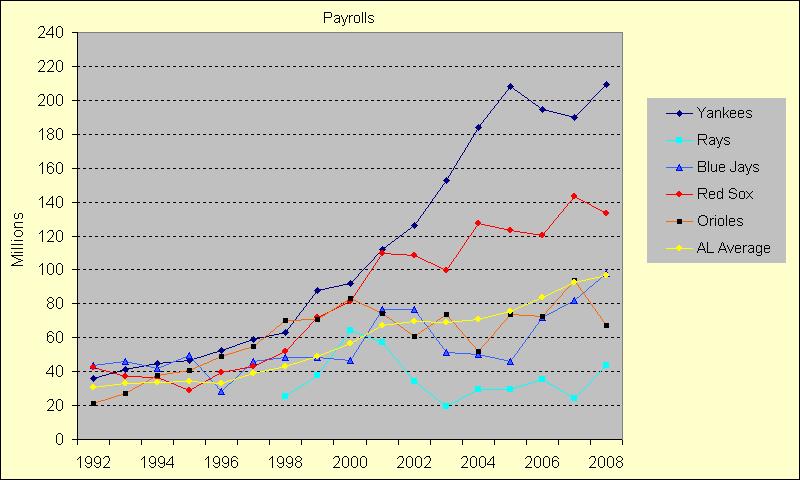
Well. Or maybe Gulp. That really, really speaks for itself. I don't know what I could possibly add, except to note that you can actually see Steinbrenner's growing desperation since the shocking conclusion of the 2001 World Series to win just one more time. As you can see, both the Orioles and the Red Sox did their best to keep pace with the Yankees through 2000 - at which point, Angelos started cutting back in Baltimore. Meanwhile the Yankees and Red Sox have just kept raising the ante to the point where no one else can even afford to get into the game.
Here is the AL Central
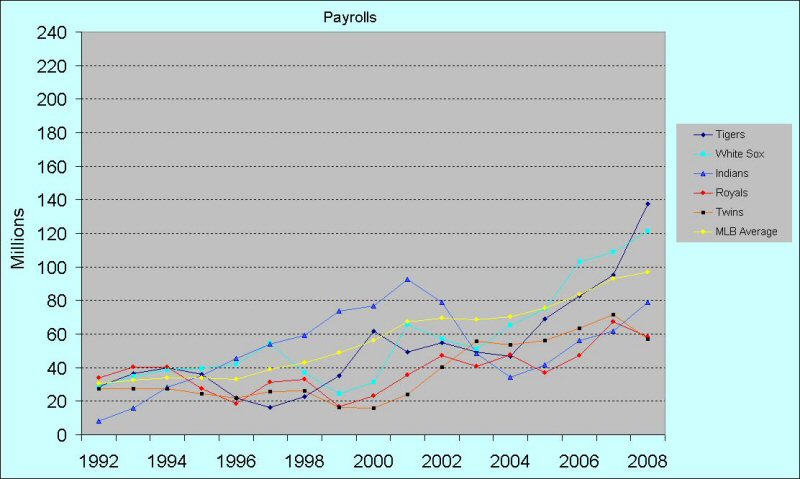
Since it opened for business in 1994, things in the Central have been fairly fluid. Everyone - even the Royals - have had the highest payroll at one time or another. The Royals cut that out of their act soon enough, and have generally just showed up to provide an opposing team. The Tigers have never won the division either, but they're the ones spending the most money these days. They've made a recent World Series appearance and everything. But during most of this time, Cleveland, Chicago, and Minnesota have been the on-field powers - Cleveland has won the division seven times and made a couple of World Series appearances. The Twins have won the division four times, the White Sox three times (but the White Sox did go to, and win, a World Series along the way.) The payrolls have been fairly stable, at least compared to the AL East. As the Data Table at the bottom indicates, a number of the AL Central teams seem to have attempted to spend about the same amount of money year after year. This is never going to keep work - both real world inflation and baseball inflation are working to make sure that you get less and less bang for your buck the farther along you go with such a strategy. Meanwhile, the Indians were finding it necessary to try to hold on to all that glittering young talent - Albert Belle, Jim Thome, Manny Ramirez - that had launched them first into contention, and eventually into complete and utter domination of this group. The White Sox kept pace for a while, and then seem to have paused, and put their faith in a Collective Bargaining Agreement that Jerry Reinsdorf might find more to his tastes. When that didn't quite work out, and with the Indians slipping, they opened up their wallets again.
Even the Twins have thrown a few dollars around. They had the lowest payroll in the division in 2002, when they came away with a somewhat unexpected division title - the Indians simply collapsed, and the Twins filled the void. Their top three starters that year were Rick Reed, Kyle Lohse, and Joe Mays - which is why I don't think they were planning any parades that April. Victory took them quite by surprise, I think. Everyone remembers that they promptly cut David Ortiz loose that off-season, but it's not that they were completely unwilling to spend money. The Twins had the highest payroll in the AL Central in 2003, and won it again, and they still had the second-highest payroll when they made it a three-peat in 2004.
Now here is the AL West
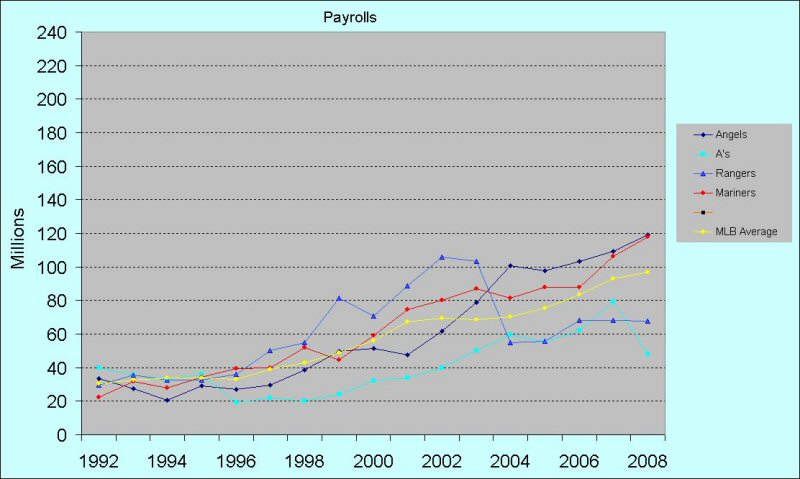
The A's once had some money - they had the highest payroll in the division when they won the West in 1992, and through 1995 all four teams wre operating with similar budgets. But the A's finished dead last in 1995, and started to cut costs drastically the following year. Meanwhile the Rangers (Ivan Rodriguez, Juan Gonzalez) and the Mariners (Ken Griffey, Randy Johnson) had the brilliant young talent getting hefty automatic raises through arbitration if nothing else. By 1997, the Rangers were spending twice as much money as Oakland - and they were beating them every year.
But in 2000, the Rangers suddenly collapsed, tuumbling to last place - Oakland filled the vacuum, and won the first division title of the Beane Era. It was a victory created by very young, and very cheap talent - Tim Hudson, Eric Chavez and Miguel Tejada weren't even arbitration eligible at this point. Mark Mulder and Barry Zito were rookies who arrived in mid-season. Texas responded by throwing almost all the money there was in the world at a shortstop (Alex Rodriguez) and a year later they threw whatever was left at a pitcher (Chan Ho Park.) Once they'd done that, they didn't feel they could also afford Rafael Palmeiro and Ivan Rodriguez, or anything resembling a competent pitcher at all. They cut bait on Rodriguez after three years and have been nursing their wounds ever since.
For most of this time, the Angels were along for the ride. They weren't spending like the division's true powers, the Mariners and Rangers - and they never won anything, either. Not until 2003, when they suddenly won 99 games and a World Series, more or less out of the blue. (They hadn't won more than 85 games since 1989.) And like the Twins, their success moved them - and forced them - to open the tap. As soon as the following season, they were the biggest spenders in the division and have remained so ever since, although the Mariners have tracked them very closely all along. Texas is still figuring out what to do next, and Oakland has a different approach, that people have written books about.
But here's my point, more or less. Billy Beane has indeed done a remarkable job doing More with Less in Oakland. But look at the other teams in his division. Oakland has usually had the lowest payroll in the division over the last ten years, but for the most part, they haven't been blown right out of the water the way teams in the AL East are. The team that was outspending them in the most grotesque fashion - Texas - was first beating them up year after year, and then drastically misallocating all of those financial resources. It helps to be smart, but it also helps when the other guys are dumb.
Well, I think I should conclude this by appending one of my Famous Data Tables. Here, in millions of dollars, are what the AL teams have been spending these past few years: