James Strapp checks in again with some information that surprised me.
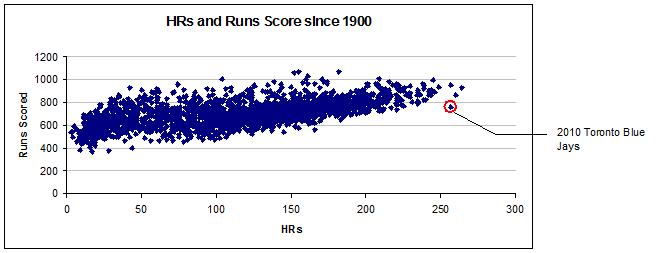
On Sunday’s pre-game radio show on the Fan 590 for the last game of the season, Alan Ashby was speculating why the Blue Jays scored so few runs relative to their massive output of home runs. We all know that with 257 home runs this season, the Jays tied for third all-time. But they did not score the number of runs one would expect from such a power outburst. It seems the answer lies in the short strokes.
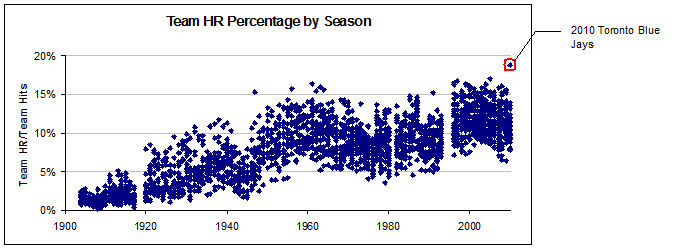
Last month, I wrote about how the Blue Jays were on track for setting an all-time record for the highest percentage of their hits being home runs, and the fewest runs per home run hit. They not only continued this trend in September, they enhanced it.
For the record, 18.8% of the Jays' hits this season were home runs, by far the highest ever (see the chart below) and up from 17.8% as August 31. (Credit again to the Lahman Baseball Database for the historic numbers.)

They also set the all-time record for fewest runs scored per home run hit, at only 2.94 (755 divided by 257).

In trying to understand the lack of runs, Alan Ashby was talking about the usual suspects: walks, stolen bases, etc.
Let’s take a look at the facts. The table below is the basic stats for the top ten home run hitting teams of all time.
|
Year |
Team |
R |
AB |
H |
1B |
2B |
3B |
HR |
BB |
SO |
SB |
|
1997 |
SEA |
925 |
5614 |
1574 |
977 |
312 |
21 |
264 |
626 |
1110 |
89 |
|
2005 |
TEX |
865 |
5716 |
1528 |
928 |
311 |
29 |
260 |
495 |
1112 |
67 |
|
2010 |
TOR |
755 |
5495 |
1364 |
767 |
319 |
21 |
257 |
471 |
1164 |
58 |
|
1996 |
BAL |
949 |
5689 |
1557 |
972 |
299 |
29 |
257 |
645 |
915 |
76 |
|
2000 |
HOU |
938 |
5570 |
1547 |
973 |
289 |
36 |
249 |
673 |
1129 |
114 |
|
2001 |
TEX |
890 |
5685 |
1566 |
971 |
326 |
23 |
246 |
548 |
1093 |
97 |
|
1996 |
SEA |
993 |
5668 |
1625 |
1018 |
343 |
19 |
245 |
670 |
1052 |
90 |
|
1999 |
SEA |
859 |
5572 |
1499 |
971 |
263 |
21 |
244 |
610 |
1095 |
130 |
|
2000 |
TOR |
861 |
5677 |
1562 |
969 |
328 |
21 |
244 |
526 |
1026 |
89 |
|
2009 |
NYA |
915 |
5660 |
1604 |
1014 |
325 |
21 |
244 |
663 |
1014 |
111 |
The Jays did have fewer walks and stolen bases than the other slugging teams, but nothing there significant enough to explain why they scored a dramatic 160 to 250 fewer runs.
Walks are an issue, yes. What stands out to me, though, is the number of singles—the excuse-me hits, Texas leaguers, seeing-eye singles, and infield hits that constitute the majority of baseball hits.
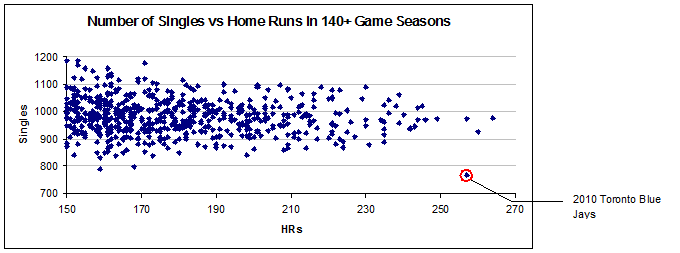
In fact, the Blue Jays set another historic record this season: the fewest number of singles ever in a full season…over the entire history of baseball going into last century…by far! With 767 one-baggers, they are the first team to hit fewer than 800 singles in a full season. This includes all the seasons when teams only played a 154-game season.
They hit fewer singles than all the teams in the strike-shortened, 144-game 1995 season. They even hit fewer singles than three of the teams in the strike-shortened 1994 season, and these teams only played 113 or so games.
One more chart to illustrate this historic anomaly.

https://www.battersbox.ca/article.php?story=20101004215007531