


They say that money can't buy love in this world
But it'll get you a half-pound of cocaine and a sixteen-year old girl
And a great big long limousine on a hot September night
Now that may not be love, but it is all right
We had a brief glance at the evolving AL payrolls a few days back. It was suggested that we should see how they do these things in the Other League.
Like this! I'm going to begin in 1994 this time, when the current three-division structure began:
First, the NL East:
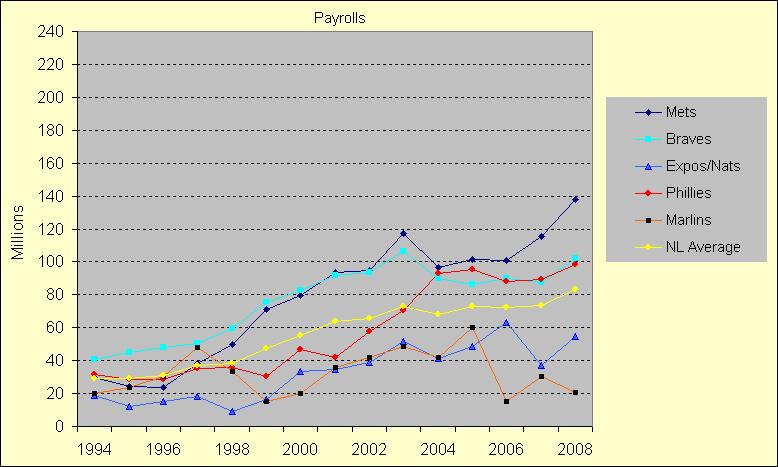
Ted Turner's Braves had always been willing to haul out the chequebook. At the very beginning of the free agent era, Turner ardently pusured any free agent who caught his fancy. It didn't work out very well for the most part, and the franchise was generally a loser. His best acquisition turned out to be Bobby Cox, who spent the last half of the 1980s retooling the farm system before turning those duties over to John Schuerholz and returning to the dugout. Byu 1994, the Braves had won three consecutive division titles and appeared in the 1991 and 1992 World Series. Success always drives up the payroll - furthermore, they were moving to a new division, where no one spent money the way the Braves, Dodgers, and Giants did.
But the Mets soon decided that they wanted to play too, and they wouldn't be able to compete with the Braves without spending like the Braves. And how could they not spend like the Braves? They're from New York, dammit! And by the late 1990s, there were two teams in the division spending money, and three others standing by. For much of this period, the Braves and Mets were the only teams in the division spending more than the league average.
Since then, two things have happened. The Phillies have stepped up - you probably can't get Pat Gillick to work for you otherwise. Meanwhile, Braves have scaled back - the disastrous Time Warner-AOL merger may have cost Ted Turner $8 billion dollars, and certainly changed the corporate support for the ball club. Turner has faded out of the picture. The Mets have taken upon the burden of being the division's biggest spenders, but the Braves and Phillies are both close enough financially to be competitive.
The Nats and Marlins are generally just along for the ride, although every now and then Florida apparently decides to throw around some money, win a World Series, and fade back into the woodwork. But not much - only the 1997 team had a really significant payroll spike. The cuts to their budget are always far more dramatic.
And here's the NL Central:
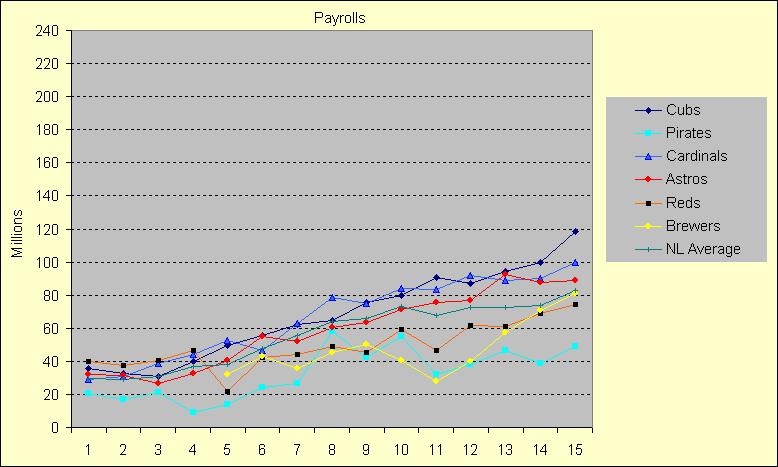
In the Central, three teams - Chicago, St. Louis, and Houston - have remained more or less in step for all of the last 15 years. The other three teams have made up a separate group - we have a kind of Upstairs, Downstairs dynamic here, although the Brewers have in recent years made a move in recent years to make a Gang of Four in the high rent section.
And the NL Worst... err, West

The Dodgers and Giants had been spending to keep up with Turner's Braves, when in 1994 Atlanta was finally moved to the NL East. Yes, for more than a quarter of century, the Western Division Braves would fly west, actually change time zones, in order to play teams in the East. The Giants slipped back a little, and were soon caught by the Padres; meanwhile, the brand new Rockies were enjoying the greatest attendance figures in history and started to match the Dodgers. And then came the Coleangelo. In just their second year of operation, the D'Backs raised the ante dramatically - only the Dodgers were willing to match, and it was Arizona who walked off with the division title. The Dodgers quickly escalated, and Arizona kept pace for a few years before drifting back to the same spending levels as the other western teams. In recent years, the Giants have spent a lot of money on old players, trying to squeeze out one last post-season appearance while Barry Bonds was still around. Those days are gone now.
It seems to me that for the most part, payroll patterns have been much more stable in the NL; as if the teams have all decided where they fit in amongst their fellows. Everybody knows his place.
Of course, George Steinbrenner doesn't have a team in the National League. It was more than twenty years ago, Pat Gillick said that it was the presence of Steinbrenner's Yankees, and how he operated, that was largely responsible for the highly competitive nature of the old AL East - Steinbrenner was always going after it, always shaking it up. George may be fading from the scene, but Hank certainly appears to be his father's son. But while every now and then, the Dodgers and Mets stretch their considerable muscle and resources, they've never really asserted them to the same degree.
Anyway, here are the actual budgets. Division winners are in bold.
You pay attention every time money talks
But it'll get you a half-pound of cocaine and a sixteen-year old girl
And a great big long limousine on a hot September night
Now that may not be love, but it is all right
We had a brief glance at the evolving AL payrolls a few days back. It was suggested that we should see how they do these things in the Other League.
Like this! I'm going to begin in 1994 this time, when the current three-division structure began:
First, the NL East:
Ted Turner's Braves had always been willing to haul out the chequebook. At the very beginning of the free agent era, Turner ardently pusured any free agent who caught his fancy. It didn't work out very well for the most part, and the franchise was generally a loser. His best acquisition turned out to be Bobby Cox, who spent the last half of the 1980s retooling the farm system before turning those duties over to John Schuerholz and returning to the dugout. Byu 1994, the Braves had won three consecutive division titles and appeared in the 1991 and 1992 World Series. Success always drives up the payroll - furthermore, they were moving to a new division, where no one spent money the way the Braves, Dodgers, and Giants did.
But the Mets soon decided that they wanted to play too, and they wouldn't be able to compete with the Braves without spending like the Braves. And how could they not spend like the Braves? They're from New York, dammit! And by the late 1990s, there were two teams in the division spending money, and three others standing by. For much of this period, the Braves and Mets were the only teams in the division spending more than the league average.
Since then, two things have happened. The Phillies have stepped up - you probably can't get Pat Gillick to work for you otherwise. Meanwhile, Braves have scaled back - the disastrous Time Warner-AOL merger may have cost Ted Turner $8 billion dollars, and certainly changed the corporate support for the ball club. Turner has faded out of the picture. The Mets have taken upon the burden of being the division's biggest spenders, but the Braves and Phillies are both close enough financially to be competitive.
The Nats and Marlins are generally just along for the ride, although every now and then Florida apparently decides to throw around some money, win a World Series, and fade back into the woodwork. But not much - only the 1997 team had a really significant payroll spike. The cuts to their budget are always far more dramatic.
And here's the NL Central:
In the Central, three teams - Chicago, St. Louis, and Houston - have remained more or less in step for all of the last 15 years. The other three teams have made up a separate group - we have a kind of Upstairs, Downstairs dynamic here, although the Brewers have in recent years made a move in recent years to make a Gang of Four in the high rent section.
And the NL Worst... err, West
The Dodgers and Giants had been spending to keep up with Turner's Braves, when in 1994 Atlanta was finally moved to the NL East. Yes, for more than a quarter of century, the Western Division Braves would fly west, actually change time zones, in order to play teams in the East. The Giants slipped back a little, and were soon caught by the Padres; meanwhile, the brand new Rockies were enjoying the greatest attendance figures in history and started to match the Dodgers. And then came the Coleangelo. In just their second year of operation, the D'Backs raised the ante dramatically - only the Dodgers were willing to match, and it was Arizona who walked off with the division title. The Dodgers quickly escalated, and Arizona kept pace for a few years before drifting back to the same spending levels as the other western teams. In recent years, the Giants have spent a lot of money on old players, trying to squeeze out one last post-season appearance while Barry Bonds was still around. Those days are gone now.
It seems to me that for the most part, payroll patterns have been much more stable in the NL; as if the teams have all decided where they fit in amongst their fellows. Everybody knows his place.
Of course, George Steinbrenner doesn't have a team in the National League. It was more than twenty years ago, Pat Gillick said that it was the presence of Steinbrenner's Yankees, and how he operated, that was largely responsible for the highly competitive nature of the old AL East - Steinbrenner was always going after it, always shaking it up. George may be fading from the scene, but Hank certainly appears to be his father's son. But while every now and then, the Dodgers and Mets stretch their considerable muscle and resources, they've never really asserted them to the same degree.
Anyway, here are the actual budgets. Division winners are in bold.
AVG Mets Atl Wsh Phil Flor Chi Pgh StL Hou Cin Mil LA SF SD Col AriMoney talks and when you've been bought
1994 29.4 29.9 40.5 18.6 31.4 20.3 35.7 20.3 29.0 32.0 39.8 -- 37.2 40.1 13.5 23.0 --
1995 29.0 24.3 45.2 12.0 28.6 23.7 32.5 17.0 31.0 31.6 37.2 -- 30.5 34.9 25.9 31.1 --
1996 31.1 23.5 47.9 15.4 28.4 30.1 31.0 21.3 38.7 26.9 40.7 -- 34.6 34.6 27.1 34.9 --
1997 36.9 38.5 50.5 18.3 35.5 47.8 39.8 9.1 44.2 32.9 46.3 -- 43.4 33.5 34.7 42.9 --
1998 38.0 49.6 59.5 9.2 36.1 33.4 49.4 13.8 52.6 40.6 22.0 32.3 48.0 40.3 45.4 47.4 28.9
1999 47.6 71.3 75.1 16.4 30.5 15.2 55.4 24.2 46.2 55.3 42.1 42.9 70.9 46.1 45.9 54.4 70.4
2000 55.4 79.8 82.7 33.5 46.9 19.9 62.1 26.6 63.1 52.1 44.2 35.8 90.4 53.5 55.0 61.3 79.2
2001 63.8 93.7 91.9 34.8 41.7 35.6 64.5 57.8 78.3 60.4 48.8 45.1 109.1 63.3 38.9 71.5 85.2
2002 65.8 94.6 93.5 38.7 58.0 42.0 75.7 42.3 74.7 63.4 45.1 50.3 94.9 78.3 41.4 56.9 102.8
2003 72.9 117.2 106.2 51.9 70.8 48.8 79.9 54.8 83.8 71.0 59.4 40.6 105.9 82.9 45.2 67.2 80.7
2004 67.8 96.7 90.2 41.2 93.2 42.1 90.6 32.2 83.2 75.4 46.6 27.5 92.9 82.0 55.4 65.1 69.8
2005 72.8 101.3 86.5 48.6 95.5 60.4 87.0 38.1 92.1 76.8 61.9 39.9 83.0 90.2 63.3 48.2 62.3
2006 72.4 101.1 90.2 63.1 88.3 15.0 94.4 46.7 88.9 92.6 60.9 57.6 98.4 90.1 69.9 41.2 59.7
2007 73.7 115.2 87.3 37.3 89.4 30.5 99.7 38.5 90.3 87.8 68.9 71.0 108.5 90.2 58.1 54.4 52.1
2008 83.0 137.8 102.4 55.0 98.3 20.8 118.3 48.7 99.6 88.9 74.1 80.9 118.6 76.6 73.7 68.7 66.2
You pay attention every time money talks
