


Standings as of June 19th:
Team             W	 L	 PCT	 GB
Washington	40	29	.580	 -
Philadelphia	38	32	.543	2.5
Atlanta	        36	33	.522	4.0
Florida	        34	32	.515	4.5
NY Mets	        33	36	.478	7.0
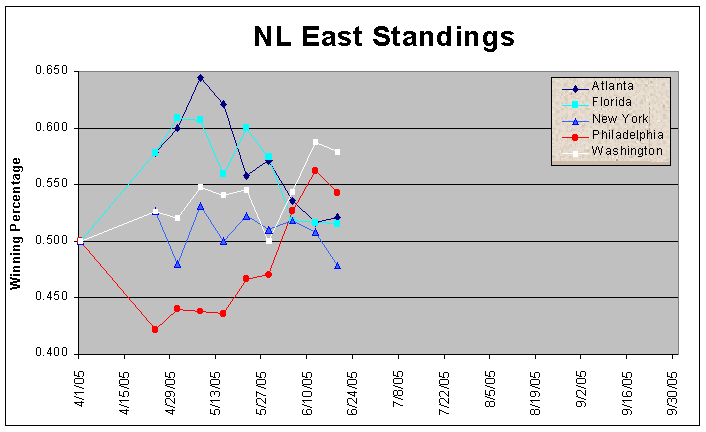
Clear as mud, huh?
The Nats and Phils continue to surge, while the Braves, Marlins and Mets have faded lately.
Atlanta Braves
Overall Record: 36-33
Run Differential: +38
Record in last period: 6-7
The Braves corner outfielders have been a big problem for them all year. They started the year with a couple proven veterans, who proved that they were indeed still bad players. Kelly Johnson and Ryan Langerhans have been getting more time lately. Andruw Jones is having a strong year at the plate, but overall the Brave OFs are the worst in the division by a lot.
Player	        PA	BA	OBP	SLG	VORP
Andruw Jones	281	0.259	0.324	0.542	19.6
Ryan Langerhans	150	0.242	0.320	0.447	 3.6
Kelly Johnson	 60	0.180	0.317	0.380	-0.3
Raul Mondesi	155	0.211	0.271	0.359	-4.3
Brian Jordan	203	0.229	0.276	0.293	-7.7
Total					        10.9
Florida Marlins
Overall Record: 34-32
Run Differential: +24
Record in last period: 6-6
The Marlins have two good OFs this year. Cabrera is no surprise - he's one of the best young players in the game. The surprise is that Encarnacion is playing decently while Juan Pierre is below replacement level at the moment.
Player	        PA	BA	OBP	SLG	VORP
Miguel Cabrera	273	0.336	0.385	0.559	30.8
J Encarnacion	263	0.264	0.342	0.455	12.0
Jeff Conine	 91	0.253	0.352	0.316	 1.0
Juan Pierre	279	0.247	0.294	0.317	-2.7
Total					        41.1
New York Mets
Overall Record: 33-36
Run Differential: -2
Record in last period: 4-9
Mike Cameron, despite missing the start of the season, leads the Met OFs in VORP. Cliff Floyd has remained healthy and is second among Met OFs. And then there's Carlos Beltran, who while not awful, is certainly not earning his paycheck at the moment. You have to imagine it's just a matter of time for him to get back to an All Star level.
Player	        PA	BA	OBP	SLG	VORP
Mike Cameron	148	0.320	0.426	0.584	20.8
Cliff Floyd	253	0.278	0.340	0.517	17.3
Carlos Beltran	260	0.267	0.323	0.428	 8.9
Victor Diaz	139	0.250	0.374	0.457	 7.5
Eric Valent	 50	0.186	0.300	0.256	-2.0
Total					        52.5
Philadelphia Phillies
Overall Record: 38-32
Run Differential: +8
Record in last period: 8-5
Here's how the other four team's OF looks, in terms of total VORP among OFs:
Mets        52.5
Nationals   45.0
Marlins     41.1
Braves      10.9
Then there's Bobby Abreu on his own: 42.1 VORP
And while Abreu has been an MVP candidate, Pat Burrell and Kenny Lofton aren't doing so bad either.
Player	        PA	BA	OBP	SLG	VORP
Bobby Abreu	307	0.323	0.440	0.566	42.1
Pat Burrell	262	0.311	0.401	0.545	26.4
Kenny Lofton	141	0.379	0.454	0.468	17.6
Jason Michaels	154	0.271	0.377	0.364	 4.2
Endy Chavez	 49	0.149	0.184	0.213	-5.7
Total					        84.6
Washington Nationals
Overall Record: 40-29
Run Differential: -5
Record in last period: 9-3
Raise your hand if you thought Ryan Church would be the National's best OF this year. I didn't see it either. Wilkerson and Guillen have received the bulk of the time, but there's been a number of other players that have rotated through the OF.
Player	        PA	BA	OBP	SLG	VORP
Ryan Church	165	0.320	0.376	0.540	16.2
Brad Wilkerson	276	0.270	0.366	0.439	14.1
Jose Guillen	270	0.285	0.326	0.476	13.8
Marlon Byrd	 82	0.314	0.378	0.386	 3.3
Tony Blanco	 42	0.275	0.310	0.425	 1.0
Terrmel Sledge	 46	0.243	0.348	0.378	 0.9
J.J. Davis	 28	0.231	0.286	0.231	-1.9
Jeff Hammonds	 37	0.206	0.270	0.235	-2.4
Total          					45.0
NL East OF Top 5 VORP:
Bobby Abreu	307	0.323	0.440	0.566	42.1
Miguel Cabrera	273	0.336	0.385	0.559	30.8
Pat Burrell	262	0.311	0.401	0.545	26.4
Mike Cameron	148	0.320	0.426	0.584	20.8
Andruw Jones	281	0.259	0.324	0.542	19.6
The Nationals have the worst run differential in the division yet they're in first place. This is a fluke, right?
