Batter's Box Interactive Magazine Batter's Box Interactive Magazine Batter's Box Interactive Magazine
It has long been my custom to examine some odds and ends at the conclusion of the regular season, once the final game is in the books and I've had a chance to update my Big Honking Database.
Today we'll check in with Pythagoras, ancient Sage of Samos.

As everyone knows, the number of games a team wins and loses can generally be predicted by the relationship between the runs they score and give up. Elementary, my dear Watson. We are interested, as always, in the teams that don't match up to their Pythagorean expectation. There are two, and only two, reasons this can happen: a) an unusual level of performance in close games in general, one-run games in particular or b) an unusual record in blowouts. The right combination of unusual performance in both of these areas can produce some very, very strange results indeed.

What makes this especially interesting is that these two explanations say completely different things about the ball club affected. If a team has an exceptionally good or bad record in one-run games, they've just had a run of strange luck, one way or the other. That is all. The results of one-run games really are as random as a roll of the dice. To repeat, for the umpteenth time, my Mantra of the One-Run Game:

In a close game, the impact of random chance is sufficient to overwhelm the impact of overall quality.


My favourite example (because it's recent!) of this particular phenomena comes from 2003. You remember that unspeakably awful Detroit Tigers team, who went 43-119? The 2003 Tigers had a better record in one-run games (19-18) than the 2003 Atlanta Braves, who finished first and won 101 games that year. Those Braves went just 17-25 in one-run games. That sort of thing happens all the time, and represents one of the fundamental truths of the game - that one-run games are one of the mechanisms that enforce the Law of Competitive Balance, dragging everyone towards .500, pulling the bad teams up and dragging the good teams down.

Blowouts, on the other hand, actually tell us something about a team's quality. As a general rule, you just don't lose by six runs because you caught a bad break. Nor do you win by six runs because you got a little bit lucky that day.  It takes genuine ability to make a habit of beating the other team senseless.

Something else I like to keep an eye on. Two years ago, I introduced a brand new phrase to the Baseball Lexicon: the Pythagorean Swing. It caught on like wildfire - why, scarcely a baseball conversation takes place without its mention. I'm sure there's no need to explain it to this crowd. But let us take no chances, and save one or two of you the trouble of looking up the original explanation. Suppose a team (and yes, this is a real team) underperformed it's Pythagorean expectation in 2008 by 3 games. Let us then suppose that this very same team then went out and over-performed its Pythagorean expectation in 2009 by 9 games. That's a 12 game swing to the good, right there without the team doing anything different on the field. 

And in fact, this particular team really didn't do anything different on the field. Not even a little bit. They scored 1 - yes, one - more run than they had scored in 2008. They allowed 5 more than they had allowed in 2008. Yet their record went from 63-99 to 75-87. Ladies and gentlemen, I give you the 2009 San Diego Padres. It happens to someone, almost every year. This year's example comes from the great state of Texas...

So let's pull up this year's Pythagorean standings.

             PYTHAGORAS SAYS                            REAL WORLD              Difference From
                                                    Pythagorean Expectation
Team    Ex W  Ex L  GBL  Pyth Ex    RS    RA    |    W    L    GBL    PCT   |  2011 2010   SWING

NYY    103    59     -  .635    867    657    |    97    65   -    .599   |   -6 -3   -3
BOS    95    67    8   .585    875    737    |    90    72   4    .556   |   -5 0 -5
TB    92    70    11   .570    707    614    |    91    71   6    .562   |   -1 -2 1
TOR    79    83    24   .488    743    761    |    81    81  16    .500   |    2 1 -1
BAL    65    97    38   .404    708    860    |    69    93  28    .426   |    4 5 -1

DET    89    73     -  .551    787    711    |    95    67   -    .586   |    6 -1 7
KC    78    84    11   .479    730    762    |    71    91  24    .438   |   -7 4  -11
CHI    75    87    14   .462    654    706    |    79    83  16    .488   |    4 2 -2
CLE    75    87    14   .462    704    760    |    80    82   15    .494   |    5 0 5
MIN    60   102    29   .372    619    804    |    63    99   32    .389   |    3 1 2

TEX    100    62     -  .615    855    677    |    96    66    -    .593   |   -4 -2 -2
LAA    85    77    15   .526    667    633    |    86    76   10    .531   |    1 1 0
OAK    77    85    23   .474    645    679    |    74    88   22    .457   |   -3 -5   2
SEA    65    97    35   .404    556    675    |    67    95   29    .414   |    4 2 -2

PHI    104    58     -  .645    713    529    |   102    60    -    .630   |   -2 1 -3
ATL    86    76    18   .529    641    605    |    89    73   13    .549   |    3 -3 6
WSN    78    83    26   .485    624    643    |    80    81   21.5  .497   |    2 -2 4
NYM    78    84    26   .484    718    742    |    77    85   25    .475   |   -1 -2   1
FLA    72    90    32   .442    625    702    |    72    90   30    .444   |    0 -1 1
                                                   
MIL    91    71     - .561    721    638    |    96    66    -    .593   |    5 2 3
STL    89    73    2   .548    762    692    |    90    72    6    .556   |    1 -6 7
CIN    83    79    8   .510    735    720    |    79    83   17    .488   |   -4 -1   -3
CHC    69    93    22   .428    654    756    |    71    91   25    .438   |    2 3 -1
PIT    69    93    22   .423    610    712    |    72    90   24    .444   |    3 6 -3
HOU    61   101    30  .374    615    796    |    56   106  40    .346   |   -5 9 -14

ARI    89    73        .549    731    662    |    94    68    -    .580   |    5 -3 8
LAD    85    76    10   .525    644    612    |    82    79   11.5  .509   |   -3 2   -5
SF    80    82    14   .493    570    578    |    86    76    8    .531   |    6 -3 9
SD    79    83    17   .485    593    611    |    71    91   23    .438   |   -8 -2   -6
COL    79    89    17   .485    735    774    |    73    89   21    .451   |   -6 -4  -2

Pythagoras doesn't know anything about dysfunctional clubhouses; in his view, the Boston Red Sox were a better team than Tampa Bay, and should have finished ahead of them. On his site, Bill James has tentatively identified what happened to Boston and Atlanta as the two worst September collapses in the history of baseball:

The Red Sox blew a 10-game lead to a team that wasn't even playing well with a sustained month of horrific baseball....Believe me, I'd do anything I could to avoid being associated with a historic disaster, but. . .facts are facts


However, while the Red Sox were one of 2011's more notable 2011 Under-achievers, the Braves actually exceeded their Pythagorean expectation by three games (something they almost never did during the late stages of the Bobby Cox era. They did do some other things better!) Anyway, 21 of the 30 MLB teams posted records that were reasonably close to what their runs scored and allowed would have us to expect. It's the exceptions, as always, that interest us:

Overachievers


Cleveland - The Indians stayed in the AL Central hunt for much of the season. They faded to an 80-82 finish, but that still represented an 11 game improvement on their 2010 campaign and I think their fans were generally encouraged by the season. Some caution is definitely called for. They were outscored by 56 runs - they did indeed improve themselves, just not quite as much as it appears. They played much more like a 75 or 76 win team. They went 14-25 in blowouts, which is not a good sign. But they played a ton of close games, and did pretty well in them (30-26)

Detroit - Like Cleveland, the Tigers made a considerable improvement on their 2010 campaign - Detroit won 14 more games, ending up with a 95-67 record. Roughly half of that improvement was genuine, and the other half was Pythagoras smiling upon them. It was totally unnecessary, as they would have coasted to a first place finish without his help. The Tigers were a good team (they went 24-18 in blowouts) - but even more, they were a lucky team. They played .630 ball (29-17) in one-run games, which was by far the best mark in the AL.

Milwaukee
-  Another version of the same story. The Brewers made an enormous improvement, winning 19 more games than they had the previous season. Most of this was the team's own doing, but Pythagoras helped them all along, and gave them an extra six wins or so. Like the Tigers, the Brewers were a good team that got extremely lucky in the close games - the Brewers were one of the best teams in the NL in one-run games, playing .625 ball (30-18).

Arizona
- The Diamondbacks improved even more than the Brewers, improving their record by a whopping 29 games. The D'Backs had the Pythagorean Swing working for them. The 2010 team wasn't quite as bad as they looked (they should have won some 68 games instead of 65) and this year's team wasn't quite as good (they should have won about 89 games instead of 94.) They were legitimately about 20 games better than they were the year before - which is a lot - and they caught some breaks as well. Most notably, they went 28-16 in one run games. That's a .636 winning percentage, best in the majors.

San Francisco - The defending champs hung around in the NL West for most of the season, and finished with a respectable enough 86-76 record. It flatters them. They're just not a particularly good team. They were outscored by their opponents and should have finished about 80-82. They went 15-20 in blowouts, which is not a good sign. However, they played a great many close games and they did very well, playing .600 ball (33-22), leading the majors in one-run victories. That type of performance, being based entirely on dumb luck, is not sustainable. So it will be interesting to see if they realize their true situation. Very often, teams in this situation convince themselves that they're quite close to being in contention and fail to address their problems. Which then rise up and bite them, often savagely.

Underachievers

Kansas City - The Royals made a very modest improvement to their W-L record, going from 67 wins to 71. In fact, the team was much, much better than the previous season's. The 2010 team was fortunate to win 67 games - they weren't quite that good, but Pythagoras gave them a break of about four games. Whereas this year's team was extremely unfortunate in winning only 71 - Pythagoras turned his back, and gave them an extra seven losses. That's an 11 game Pythagorean Swing (plus 4 to minus 7,) the biggest in the AL. While they lost more than 90 games yet again they should have finished much closer to .500. The Royals broke even in blowouts (19-19) but did not play well in close games (25-32 in one-run games.) Only one team in the majors (Cincinnati) lost more games by a single run. What all this means is that Kansas City is in the exact opposite situation as the Giants. But as the Royals just lost 91 games, they're going to believe (unlike the Giants) that they have a lot of work to do. Which they do, but they're still much, much closer to Detroit than this year's W-L record would have you believe. The gap between the two teams is closer to 10 games than it is 25.

New York - The Yankees fielded a very, very good team this season, a better team (in my opinion) that was generally realized. They did win 97 games, which is pretty good, but they could have easily won well more than 100 games. Certainly, Pythagoras thinks they should have. Their pitching, maligned by almost everyone, was extremely effective; their defense, despite the ancient relics on the left side of the infield, was outstanding. And they can hit a little. The Yankees made a habit of beating the other fellows senseless, which is always the mark of a quality team - they went a staggering 34-13 in blowouts. But they weren't particularly lucky in the close ones, going just 21-24 in one-run games. Well, they had enough margin to play with.

Boston - For more than four months, the Red Sox looked like a historically great team. As good as the Yankees were, they were looking up at the Red Sox when September rolled around - and the Red Sox had been generous enough to give the rest of the league a head start by going 2-10 to start the season. In the end, after their collapse, they look like a somewhat lesser version of the Yankees. A powerful team, that beat the crap out of their opponents on a regular basis (32-17, almost as good as the Yankees) but only managed to break even in the close games (19-19 in one-run games.)

Colorado
The Rockies main problem was the  close games - they went 21-27 in one-run games. They weren't very good in blowouts  (18-24) overall, but they did show a flair for piling up truly ridiculous margins of victory. They were 5-3 in games decided by eight runs or more, and won both their games ten or more runs. It's only two games, yes, but they outscored their opponents by a total of 27 runs in just two games. Kind of skewed everything a little bit.

Houston - The Astros had a disastrous campaign, losing 20 times more often than they had the previous season. Like the Royals, they were caught in an evil Pythagorean Swing. The 2010 team was, in reality, almost as bad as this year's model - but they got lucky in some close games and stumbled to a 76-86 record that was considerably better than they deserved. Pythagoras says they caught a 9 game break to the good in 2010, and should have won some 67 games. This year, they should have won about 61, but Pythagoras gave them a 5 game swing to the bad - That's a total Pythagorean swing of 14 games in the wrong direction, the biggest such swing in the majors, and that accounts for the largest part of this year's disaster. When you're as bad as these guys, you'll clutch at any straw you can see. So let's note that the 2011 Astros actually improved slightly in blowouts, going from a grisly 12-31 in 2010 to a merely awful 15-28 this season.

San Diego - The Padres problem this season was very simple to spot - they were extremely unlucky. They went 20-31 in one-run games, the worst mark in all of the majors. That's most of what happened to them. They weren't as good as they had been the year before - their best player was in Boston - but in terms of quality they were still pretty close to being a .500 team (and indeed, they went 17-17 in blowouts.) They were only outscored by 18 runs in 2011, and they shouldn't have lost 21 times more often than they won.

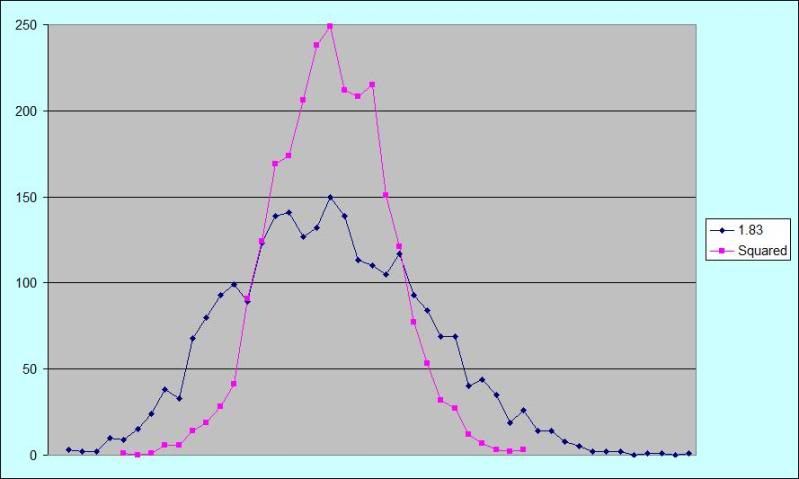
Finally, a note on The Method, as Descartes (or was it Sartre?) might say. The Pythagorean formula I use to derive a team's Expected W/L record is the one devised by Bill James back at the Dawn of Time. It  uses the square of a team's runs scored and allowed to produce the expected winning percentage. It has been been suggested that using an exponent, rather than the square is more accurate (or more preferable - I'm not sure you can say more "accurate,"  as we're merely creating a formula for an imagined result. The figures 1.83 and 1.83 have been proposed as suitable exponents.  I'm not sure why they might be preferable, but I can definitely tell you this - the Pythagorean expectations produced by using the original formula (squared) produces results that match much more closely the actual W/L records of baseball teams.

Which certainly makes it preferable to me. My interest is in finding those teams whose performance does not match their Pythagorean expectation. I'd rather not use a formula that manufactures such teams with abandon. Which, it seems to me, is exactly what the formula using the exponent does.

Allow me to demonstrate, with a Data Table and a Pretty Picture, how these two Pythagorean methods cope with the 2490 seasons in the Big Honking Database. How often does each method match what happened?.

Pythag W             1.83    Squared
exceed          formula formula
Actual W by

19        3    0
18        2    0
17        2    0
16        10    0
15        9    1
14        15     0
13        24     1
12        38     6
11        33     6
10        68     14
9        80     19
8         93     28
7         99     41
6         89    91
5         123     124
4        139     169
3         141     174
2        127     206
1         132     238
0        150     249
-1        139     212
-2         113     208
-3        110     215
-4        105     151
-5         117    121
-6         93     77
-7         84     53
-8        69     32
-9        69     27
-10        40     12
-11        44    7
-12        35     3
-13         19     2
-14        26     3
-15        14    0
-16        14    0
-17         8    0
-18        5    0
-19         2    0
-20         2    0
-21         2    0
-22         0    0
-23         1    0
-24         1    0
-25         0    0
-26        1    0


PhotobucketPretty Picture

I think you would prefer to use the formula that is more likely to mirror actual W/L records. You want as many seasons as possible in the centre of that Pretty Picture.

Or you could look at it this way...

Difference        Exponent    Squared
Pythag & Actual   Formula     Formula

 0 wins 150 249
 1 271 450
 2 240 414
 3 251 389
 4 244 320
 5 240 245
 6 182 168
 7 183 94
 8 162 60
 9 149 46
10 108 26
11 77 13
12 73 9
13 43 3
14 41 3
15+ 76 1

To take a specific example, let's consider the San Diego Padres, one more time. In 2010, they scored 665 runs and allowed 581; according to the Squared formula, they should have gone 92-70; according to the Exponent formula, they should have gone 86-76. (They actually went 90-72.) They outscored their opponents by 84 runs, and intuitively one thinks that should result in about a 10 game swing - yes, something like 86-76. Of course (on the other hand!)  they're the San Diego Padres - they play half their games in one of the greatest pitcher's parks ever built. Where it doesn't take as many runs to change the outcome of a game.

At any rate, I think it's clear that using a formula based on the exponent produces much more dramatic results - and more of them. And I may distrust it for that reason alone. Which may not be a particularly good reason, but it suits my purposes. Oh, it would have been neat and catchy and easy to be able to say "they didn't deserve to win 90 games a year ago and they didn't deserve to lose 90 games this year" - but sometimes I don't think it should be that easy.

Finally, as it's Johnny's birthday (my first role model!), I'd like to close with some Inspirational Verse:

I'm a moldy moldy man
I'm moldy thru and thru
I'm a moldy moldy man
You would not think it true
I'm moldy til my eyeballs
I'm moldy til my toe
I will not dance I shyballs
I'm such a humble Joe.
The Year in Review I - What Pythagoras Says | 98 comments | Create New Account
The following comments are owned by whomever posted them. This site is not responsible for what they say.
BlueJayWay - Sunday, October 09 2011 @ 09:20 AM EDT (#245604) #
Pythagoras was good to us this year.  Not unrelatedly, I also notice we finished over .500 for the first time in a while.  These things were most annoying during the Ricciardi years.
TimberLee - Sunday, October 09 2011 @ 09:21 AM EDT (#245605) #
This is great stuff.  TV broadcasts love to tell us late in the season how well a team has performed in one-run decisions, as if it showed something about the grittiness of the team, and I'm happy to see you emphasize and demonstrate that it doesn't.  Of course, fans love seeing their team win a bunch of close ones, and it's funny how often one hears the opinion that it's the blowouts that involve luck because the opposing starter was "having an off-day" or some such.
Mike Green - Sunday, October 09 2011 @ 09:45 AM EDT (#245606) #
Thank you for a helpful summary, Magpie. The Royals' story is very interesting, both in terms of why it happened and what it means for their immediate future. Soria was much less effective than he had been in previous years. His W/K rate was still very good, but batters were doing a much better job of laying off pitches outside the zone and squaring him up. Aaron Crow and old friend Tim Collins are capable of providing decent high-leverage relief support, but struggled for control. They are both very young. It is easy to imagine an above-average Royals' pen. But, the starters are a different story altogether.
bpoz - Sunday, October 09 2011 @ 11:05 AM EDT (#245608) #
Thanks Magpie. I have been waiting for this.

You titled it Year in Review 1, so are you going to produce 2 or more. I have some questions concerning the Jays.

I accept 1 run games is luck and I accept a lot of blowout wins means that you are good and losses that you are bad.

How did the Jays do in blowouts in 2009,10 & 11. Do they look like they are getting better. By the way what differential makes a blowout. Thanks.

IMO the 2010 team personnel did not change as much as the 2011 personnel during their season. But I could be wrong. So in 2010 the big 4 SP played most of the year, with the 5th spot being a revolving door and the 2010 pen stayed reasonably the same especially regarding the high leverage situations. I am not sure about Sept Call ups being used more in 2010 vs 2011. I am guessing the call ups were used more in 2010 due to Morrow & Cecil being shut down.
A weird case can be made that CF in 2011 was a committee, because 3 or 4 players were used.

So I do not know how to answer the above. But I felt that the Jays changed a lot from Opening Day and the day after the July 31st deadline. Maybe Pythagoras noticed or maybe not. But blowouts may give a clue. Thanks for your work even if we cannot get these answers.
Magpie - Sunday, October 09 2011 @ 12:11 PM EDT (#245609) #
By the way what differential makes a blowout.

BB-ref uses games decided by 5 or more runs as their defintion as a blowout. I'm accepting it, mainly because it lets me just copy their numbers rather than crawl through a team's schedule and figure it out for myself...

In 2009, the Jays outscored the opposition by 27 runs. They were very good in blowouts (29-21) and pretty bad in close games (21-28), which was how they ended up 9 games below their Pythag Expectation (75 wins rather than 84).

In 2010, the Jays again outscored the opposition by 27 runs. They were ordinary in blowouts (26-27) and a little better in close games, and ended up 1 game better than their Pythag (85 wins rather than 84).

In 2011, the Jays were outscored by the opposition, by 18 runs. They were a little bit better in blowouts (19-17) and a little better in one-run games (29-28), and exceeded their Pythag by two games (81 wins to 79.)

How far away are they from contending? I'd say at least 160 runs (which you may divide between offense and defense however you like.) The Yankees scored 124 more runs and gave up 104 fewer (228 runs, which suggests that the Jays were lucky to be only 16 games behind them.)

Boston scored 132 more runs and gave up 24 fewer (156 runs, and again Toronto was lucky to be just 9 games behind them.)

The Jays did outscore Tampa by 36 runs, largely because the Rays play in the league's best pitcher's park. On the other hand, Tampa gave up 147 fewer runs than Toronto. The Rays were 111 runs better than the Jays, who probably should have been a little bit closer than 10 games behind them.

They're a fourth place team on merit, and they're quite a ways behind their three rivals.
sam - Sunday, October 09 2011 @ 02:53 PM EDT (#245617) #
Is this a sufficient package for Votto? Would either team do this?

Votto

Thames/Snider
Drabek
Molina
Escobar
Marisnick

I guess we'd have to give up more? Is this a better package than what the Padres got for Gonzalez?

I don't know. The Reds match up oddly as trading partners. I mean, they don't have a need at catcher and have outfield depth in CF and RF. A SS and pitching would probably be the positions they'd like to acquire.
hypobole - Sunday, October 09 2011 @ 04:16 PM EDT (#245621) #

Before people suggest massive prospect giveaways for Votto, might want to think about 1) he's a FA in 2 years, 2) there might not be the same FA comp rules in place in 2 yrs.

Don't forget the players Tor and SD received were with the understanding extensions would be signed by Doc and AGon.

Timbuck2 - Sunday, October 09 2011 @ 04:37 PM EDT (#245622) #
Just an interesting tidbit I picked up from a family friend of the Votto's - He's quite happily "The Man" for the Reds with his face splashed on billboards all over the city.  I seriously doubt we will be obtaining his services any time soon.
TamRa - Sunday, October 09 2011 @ 04:43 PM EDT (#245623) #
Thames/Snider
Drabek
Molina
Escobar
Marisnick

Considerably TOO much, IMO, and I'm in the "pay almost any price for him" camp (provided we are confident in an extension)

First, I'm not at all sure they would front a package with Escobar, I'd guess being willing to part with Hech would be more likely - and I'm not sure how highly the rate Cozart anyway.

Second, i'd suggest another very good pitcher would attract them more than Marisnick given the presence of Stubbs and Bruce.

Something more like

Thames/Snider
Drabek (whould they be willing to consider Drabek an asset? if not, then keep him)
Molina/Hutch
Nicolino/Syndergaard/Sanchez

would be plenty, IMO

Albeit they might want players closer to the majors - wonder what their scouts think of Cecil?
smcs - Sunday, October 09 2011 @ 05:53 PM EDT (#245624) #
Boston scored 132 more runs and gave up 24 fewer (156 runs, and again Toronto was lucky to be just 9 games behind them.)

In their 18 head-to-head games, the Red Sox outscored the Jays by 60 runs (137-77).
Magpie - Sunday, October 09 2011 @ 06:39 PM EDT (#245626) #
TRIVIA!

Which former Blue Jay has a career OPS+ of 697?
Mike Green - Sunday, October 09 2011 @ 06:55 PM EDT (#245627) #
Shaun Marcum? I guess that Terry Forster never played in Toronto.
Mike Green - Sunday, October 09 2011 @ 06:57 PM EDT (#245628) #
Wrong. Marcum's career OPS+ is a rather humdrum 24. I swear that he could hit better than Johnny Mac if given a chance...
DJRob - Sunday, October 09 2011 @ 07:06 PM EDT (#245629) #
It's not Buck Martinez, Corey Patterson, John MacDonald, Orlando Hudson, Damaso Garcia, Pat Borders, Mike Bordick, Kenny Williams, or either of the Alerx Gonzaleses.
Original Ryan - Sunday, October 09 2011 @ 09:14 PM EDT (#245631) #
I was going to say Mark Hendrickson, but his OPS+ is a mere 203.
Original Ryan - Sunday, October 09 2011 @ 09:16 PM EDT (#245632) #
Clarification: that's Hendrickson's OPS+ with the Blue Jays. When you factor in his other teams, his OPS+ drops down to a whopping 4.
Thomas - Monday, October 10 2011 @ 03:36 AM EDT (#245637) #
Considerably TOO much, IMO, and I'm in the "pay almost any price for him" camp (provided we are confident in an extension)

Without commenting on the specifics, I think any package that would get Votto (who I doubt will be traded) would have to be considered too much. Someone like Votto isn't going to be acquired for a package that doesn't hurt. AGon was, I admit, but I think that was a unique situation of there being really only one suitor combined with a GM who was particularly interested in some prospects given he used to work in the front office of the other organization.

I don't think your package is enough. As you speculate, I think Cincy would want some players closer to the majors and the players near the majors they'd be receiving have huge question marks. Then they get two pitching prospects, one of whom is in the low minors. Toronto doesn't walk out of this with their best five prospects (I'm including Lawrie here as a "prospect") still in the system, which is what would happen if they got Molina in your proposal.

Thomas - Monday, October 10 2011 @ 06:39 AM EDT (#245638) #
Toronto doesn't walk out of this with their best five prospects (I'm including Lawrie here as a "prospect") still in the system

Perhaps six if you count Alvarez as a "prospect" too (which you should, as him and Lawrie are the exact sort of players Cincy would be interested in in terms of controllability and contract status, let alone talent).

dawgatc - Monday, October 10 2011 @ 10:05 AM EDT (#245640) #
our 5 best prospects including Lawrie for a first baseman is so absurd it defies logic -even a good first baseman - AA would have to be major league nuts to even consider that one and I know he's not stupid - actually no gm in history is that stupid
bpoz - Monday, October 10 2011 @ 11:14 AM EDT (#245641) #
Thanks Magpie, the info is huge.

I stated that I have a lot of faith in Pythagoras and stand by that view.

Now I have to accept that the 2009 & 2010 are equal. OK!! Hill, Lind & Doc were good, maybe they carried the team in 2009. But Doc can only directly influence the games he plays in & be a big help in saving the pen & ending long losing streaks.

I find the 2011 team to be a mess to understand.
Romero had a fantastic year 225 IP & ERA under 3.00.
The rest of the rotation disappointed.
A lot of the hitters were temporary until/if players like Lawrie arrived.
Rasmus arrived & got hurt, but at the cost of almost half our pen.
If Lind is our 2nd best hitter then his injury cost us. As well that would make our 2 best hitters losing time due to their children being born.
IMO 3B defense had to cost us a lot. How many games directly I don't know, the offensive contribution before Laurie was also weak. 3B could be the 1 position that improved from worst to best. Bautista's 1st half was better than his 2nd half. But then Lawrie cooled off a bit near the end too. It was dramatic, from red hot to just OK.


SJE - Monday, October 10 2011 @ 11:22 AM EDT (#245642) #
I am 100% with dawgatc on this one. This is not like AA other trades, like the aquisitions of Lawrie and Escobar, where you go 1 step back to go 3 steps ahead. This seems more like 2 steps or 2 years back for a very good first baseman. Its seems like we are almost willing to pay even a bigger price since Votto is also a Canadian. Dont get me wrong I love to see him play first base for the Jays but not at any cost.
Dave Rutt - Monday, October 10 2011 @ 11:38 AM EDT (#245643) #
our 5 best prospects including Lawrie for a first baseman is so absurd it defies logic

This isn't what Thomas is saying. It won't take all five - but he's saying, and I'd agree, there's no way this deal gets done without at least one, and possibly more of our top 5 prospects, which would loosely include, say, Lawrie, Alvarez, d'Arnaud, Marisnick and Gose.
92-93 - Monday, October 10 2011 @ 12:19 PM EDT (#245644) #
It's news to me that there was only one suitor for a 1B with a career road line of .303/.376/.568 and a 5.5m salary. It's pretty easy to argue that Gonzalez had significantly more value than Votto does.
hypobole - Monday, October 10 2011 @ 12:28 PM EDT (#245646) #
As far as Agon was concerned, he made it clear he'd sign an extention with the BoSox, because he wanted to play there. Any other team trying to outbid Boston may well have only had a 1 yr rental.
Ishai - Monday, October 10 2011 @ 12:51 PM EDT (#245647) #
The problem with a trade for Votto is that our greatest position of organizational depth (Catcher) is also Cincinatti's (Mesoraco, Grandal). Without being able to put together a package with d'Arnaud as the centerpiece, it becomes painful to give up enough value to land Votto.

If Cincinnati wants d'Arnaud, then you can make a package like this:
d'Arnaud
Alvarez (Alvarez reminds me of Fausto Carmona, and I'm not sure that's a good thing)
Hutchison/Nicolino/Syndegaard
maybe Thames/Snider/Lind

If they don't want d'Arnaud, then you are looking at including either Gose or Hech and something else (probably a bullpen arm like Carreno or L. Perez). It's not that I WANT to trade d'Arnaud, but I think I am more optimistic than some about JPA (because of the way he plays baseball, not because he's a likable guy, which although evidently true has been used as a reason for dismissing people who like him as bubble hearted fainty heads who can't distinguish twitter followers from OPS.)

Also, I don't believe it would be wise to try and include Drabek. His value is low and I think he'll turn it around. He has the stuff and he has had the control in the past. He probably doesn't have the maturity, but unlike stuff and desire, maturity is prone to develop with age. I think he'll end up a better pitcher than Alvarez.

And lest we lose track of the reward, Votto's career OPS (Age 23-27) is .955. He's a left-handed bat who fills an organizational position of weakness and can hit in between Bautista and Lawrie. We've been talking about how easy it is to find a good hitting first baseman since Carlos Delgado left, yet somehow we haven't found one yet. That always seems to happen when you think a position is easy to find but not everyone else agrees.
92-93 - Monday, October 10 2011 @ 01:04 PM EDT (#245649) #
It's easy to just assume CIN wants top prospects, but I wouldn't be so sure. They could be more moved by an Escobar, Lind, and Cecil kind of offer.
Original Ryan - Monday, October 10 2011 @ 01:23 PM EDT (#245651) #
They could be more moved by an Escobar, Lind, and Cecil kind of offer.

I highly doubt that. Why would Cincinnati accept two guys that are slightly older than Votto, and another guy who mysteriously lost some velocity on his fastball? That doesn't help the Reds at all. You couldn't even make that trade in a video game.

Thomas - Monday, October 10 2011 @ 01:28 PM EDT (#245652) #
Cincy may be interested in Escobar as he is youngish, signed to a team-friendly contract and fills a position of need for them. Why they'd be interested in Lind is a mystery to me. Presumably, they'd be trading Votto to open a spot for Yonder Alonso at 1B. Why they'd want a more expensive and potentially worse version of Alonso escapes me. To the extent the Votto trade rumours have legs, they exist because Alonso has proven himself too defensively limited to handle any other positions in the field, which is the state Lind is probably at these days.
Magpie - Monday, October 10 2011 @ 01:29 PM EDT (#245653) #
TRIVIA ANSWER!

It was Brandon Lyon, who has had exactly two plate appearances in his career. In the first, he walked and scored. In the second, he hit an RBI double.
Spifficus - Monday, October 10 2011 @ 01:31 PM EDT (#245655) #
A high quality SS like Escobar, under a very team favorable extension, would definitely get the conversation started. Whether the other pieces are good enough or wanted (Lind in particular, with Alphonso ready to take over from Votto) is another question.
92-93 - Monday, October 10 2011 @ 01:41 PM EDT (#245656) #
You don't trade an MVP to open a spot for a prospect.
Original Ryan - Monday, October 10 2011 @ 01:49 PM EDT (#245657) #
You don't trade an MVP to open a spot for a prospect.

But you do trade an MVP to acquire a barely adequate first baseman like Adam Lind?

92-93 - Monday, October 10 2011 @ 02:11 PM EDT (#245658) #
I'll restate my point again, this time without using names. Maybe it'll make it easier for some of you to understand.

The Reds have a very good team. Instead of prospects, like the Padres took for Gonzalez, they could be looking for players that could help them contend in 2012. Everyone keeps throwing out proposals like D'Arnaud/Marisnick/Drabek/etc. without considering the possibility the Reds are more interested in some of the established MLB talent on the Jays roster. Who that may be I have no idea.

In answer to your question, no you don't trade an MVP candidate for Adam Lind. But when the offer includes an SP with a 15w season who isn't even in arbitration yet (and would probably profile well as a 3/4 NL starter) and an all-star calibre SS with an extremely team-friendly contract you may get the conversation going.
Magpie - Monday, October 10 2011 @ 02:32 PM EDT (#245659) #
The Reds have a very good team.

No they don't, although that's hardly the issue. The question is whether or not there's a fit. The Reds need pitching, first and foremost. They also need help on the left side of the infield. They don't really need a first baseman, and I don't think even Dusty Baker would prefer to go with a Proven Veteran rather than give the job to Alonso.
Magpie - Monday, October 10 2011 @ 02:38 PM EDT (#245660) #
I would say this about the Reds - while they're not very good, their particular Form of Badness is of the type that can be improved rather dramatically. They don't really have a team of ordinary guys. They tend to have guys who are either really, really good or really, really bad. If they could come up with a decent shortstop or a decent centre fielder (not to mention a starting pitcher or two), they could get a lot better in a hurry, because they'd be replacing guys (Janish and Stubbs) who were pretty awful.
Magpie - Monday, October 10 2011 @ 02:44 PM EDT (#245661) #
You don't trade an MVP to open a spot for a prospect.

Except when you do, and it's more likely to happen at first base than anywhere else. Teams are more likely to have talent backed up at that spot than at shortstop. So the Phillies traded Jim Thome to clear a spot for Ryan Howard, as the Blue Jays traded Fred McGriff to clear a spot for John Olerud (who would in turn be sent away, opening his spot for Carlos Delgado.)
greenfrog - Monday, October 10 2011 @ 03:15 PM EDT (#245662) #
Trading Escobar would be a risky move for the Jays. Hechavarria is very much an unknown quantity at this point; if he flames out, the Jays are back to square one, with no other decent SS prospect in the system (at least, none that is remotely close to the majors).

The one area of strength for the Jays is pitching prospects in the low- to mid-minors) - we have oodles and oodles of them (catching and OF are two other areas of strength). So, basically, we need to match up with a rebuilding team that would be willing to give up an elite player for some young talent (maybe a couple of pitching prospects and a catching and/or outfield prospect).

I would hate to see Gose get traded, as he could explode on the league in a few years. Ditto for Hechavarria - he could be a good one, and it's nice to have some depth at SS.

AA might be able to move Cecil or Lind as components of the right deal, but no way those guys are the centrepiece, barring some sort of Tony Reagins-type fleecing.
Original Ryan - Monday, October 10 2011 @ 03:16 PM EDT (#245663) #
The Reds have a very good team. Instead of prospects, like the Padres took for Gonzalez, they could be looking for players that could help them contend in 2012. Everyone keeps throwing out proposals like D'Arnaud/Marisnick/Drabek/etc. without considering the possibility the Reds are more interested in some of the established MLB talent on the Jays roster. Who that may be I have no idea.

The point that the others here are trying to make is that Adam Lind and Brett Cecil are not going to be attractive players for the Reds. Those guys have limited value at best. Your trade is essentially Escobar-for-Votto, which simply isn't going to be enough.

Lind, barring a significant rebound, will not help the Reds compete in 2012. If he continues to hit like he has the past two seasons, the Reds will be paying $5 million for a guy who 1) is barely above replacement level for a first baseman, and 2) probably isn't significantly better than what they could slot in at first base (he might even be worse).

Given the number of question marks that surround Brett Cecil right now, I can't see him having much trade value. Why would a team hoping to contend in 2012 be eager to acquire him? With his drop in velocity and inconsistency this year, he has to be considered risky. Calling Cecil a "15 game winner" is misleading at best, as it's not an accurate description of the pitcher he currently is (or was, for that matter). My guess is that you only included him in your trade proposal because you knew he wouldn't be a huge loss to the Blue Jays at this point.

92-93 - Monday, October 10 2011 @ 03:56 PM EDT (#245664) #
Weird, I can't seem to find the years Jim Thome and Fred McGriff were near-unanimous choices for MVP. A 35 year old Jim Thome coming off season ending elbow surgery is hardly comparable to Joey Votto.
92-93 - Monday, October 10 2011 @ 04:08 PM EDT (#245665) #
"My guess is that you only included him in your trade proposal because you knew he wouldn't be a huge loss to the Blue Jays at this point."

You shouldn't need to guess. I explained to you why I included him. I could have used the names Escobar & Morrow and my point would remain the same.

As it is, you couldn't be any more wrong. I included Cecil because I think he has value. I'm the guy who wouldn't hesitate to trade Bautista for Votto straight up, so it clearly wasn't a case of me trying to dump off spare parts on the Reds.
Magpie - Monday, October 10 2011 @ 04:10 PM EDT (#245666) #
A 35 year old Jim Thome coming off season ending elbow surgery is hardly comparable to Joey Votto.

True, but he was still Jim Freakin' Thome, and he would give the White Sox seasons with an OPS+ of 155 and 150 over the next two years. Since the trade, in fact, Thome's played 747 games and posted an OPS+ of 141 - Ryan Howard has played 920 games with an OPS+ of 139. And just because MVP voters didn't seem to like McGriff doesn't change the fact that he'd been the best hitter in his league 1989 (just like Votto), one of the best in 1990 (just like Votto), and had just turned 27 years old (a year younger than Votto.)
TamRa - Monday, October 10 2011 @ 04:16 PM EDT (#245667) #
I would say this about the Reds - while they're not very good, their particular Form of Badness is of the type that can be improved rather dramatically. They don't really have a team of ordinary guys. They tend to have guys who are either really, really good or really, really bad. If they could come up with a decent shortstop or a decent centre fielder (not to mention a starting pitcher or two), they could get a lot better in a hurry, because they'd be replacing guys (Janish and Stubbs) who were pretty awful.

I was under the impression that they thought highly of Cozart as their future at SS - BA ranked him their #8 prospect a year ago and he hit well in limited action this year.

We all know Meseraco is going to fix the catching spot (in theory) and the only reason to trade Votto is faith in Alonso at 1B.

I haven't seen much to imply they are unhappy with Stubbs because he's so good on defense.

There are other prospects that are top 10 and presumably are the future at LF and 3B - Juan Francisco was called the best power hitter in the system and he is close enough that he got 47 major league at bats so he would seem to be the successor to Rolen if he can field the position.

Yorman Rodriguez, OTOH, seems pretty far away as does Hamilton.

So it seems to me that in terms of "ready for the majors" hitters, what screams out at you is LF.

if you look at '12-'13-'14
C- Meseraco
1B - Alonso
2B - Phillips > stopgap( Janish?) > Hamilton
SS - Cozart
3B - rolen > Francisco
RF - Bruce
CF - Stubbs (?)
LF - ???

the one obvious place where we match is LF. Even if you want to argue they can do better than Stubbs, the best we can offer them is Gose and it will be  something like 2015 before we can assume Gose will be a notably  better hitter in the majors than Stubbs. That's not immediate help.

If they want immediate help, they want STARTING PITCHERS

Cueto is a potential ace if he can stay healthy, Chapman would be too if they wise up and use him as a starter. Leake is solid, Baily is an ok choice for # 4 or 5. but there are some if's there for sure.

to me, for all the poor-mouthing of Cecil, i think he is regarded as a reasonably solid guy for the mid-to-back of the rotation. You can't build a deal around him but he certainly has value, major league starters are just too hard to find.

Morrow, if we wanted to sacrifice him, or Alvarez (likewise) would certainly slot in as, say, their #3 and make them happy.

I LOVE Brandon Morrow but i'm open to the idea of using him to get Votto so long as i don't have to add another 4 or 5 good players besides (and Votto signs an extension!) I don't want to let Alvarez go.

I don't suppose we'll ever agree about the relative value of Thames v. Snider or their relative value to the jays as opposed to the Reds. personally, I think a LOT of teams will look at Snider just like we all looked at Rasmus and say "give me a shot at that guy"

I'd rather not deal Snider but with Gose on the horizon and Thames around, I'd probably do it with the same caveats as with Morrow.

So, for me, i think this:

Snider
Cecil
Hutch or Molina
Nicolino or Synderaard or Sanchez

is a perfectly respectable offer which most closely addresses their needs now while adding great value to their system.
(I;d still rather sell them on Thames i guess but i'm trying to recognize sacrifice is necessary)

92-93 - Monday, October 10 2011 @ 04:16 PM EDT (#245668) #
Thome gave CWS all that production at DH. If he had to play 1B everyday like Howard has done over that time frame his OPS+ would be significantly lower.

I tried to stay away from McGriff because I don't know the circumstances surrounding his departure well enough. You're making it seem like Gillick dumped McGriff specifically to open a hole for Olerud; I thought it was to acquire the services of Carter and Alomar, and that that was the only way to get it done.
TamRa - Monday, October 10 2011 @ 04:30 PM EDT (#245669) #
I included Cecil because I think he has value.

The impression by many here seems to be that Cecil went off a cliff in 2011 or something. While the velocity issue can't be ignored, he's also a 24 YO LHP who was a first round draft pick - he's not exactly the second coming of Dave Eveland.

Comparing Cecil '10 with Cecil '11 you find:

WHIP - 1.326 - 1.326
H/9 - 9.1 - 8.9
BB/9 - 2.8 - 3.1
K/9 - 6.1 - 6.3
HR/9 - 0.9 - 1.6

As you can see, he had a minor drop in control, and a considerable rise in HR rate - which one would assume is also ultimately a control issue in that he was leaving pitches up at a higher rate.

In every other respect, he did not regress at all. Not only that, from July 1 to the end of the season his ERA was 4.02, and his numbers as listed above are:
WHIP was 1.22
H/9 was 8.41
BB/9 was 2.6
K/9 was 6.2
HR/9 was still 1.6

I don't think the rival GM just looks at the W-L and ERA and says "not much there" - they do more statistical analysis than we do, plus they have scouts.

Plus, Walt Jocketty is more an Old School guy for what that's worth.

I agree with you in the quoted remark - jays fans are badly underestimating Cecil's value, IMO.


BlueJayWay - Monday, October 10 2011 @ 04:33 PM EDT (#245670) #
Alvarez (Alvarez reminds me of Fausto Carmona, and I'm not sure that's a good thing)

Well, a Fausto Carmona that doesn't walk anyone.

In any case, I like Alvarez, but not enough to avoid trading him as part of a package for Votto.

For what it's worth, I think the most likely scenario is Votto is not dealt this winter.  I think the Reds will listen to offers but ultimately keep him for now.  But if he is dealt, the Jays are the most likely destination.


Mike Green - Monday, October 10 2011 @ 04:40 PM EDT (#245671) #
I do not know that Mesoraco will solve the Reds' catching problem. The odds are pretty good however that one of Mesoraco and Grandal will.

Magpie's point that the Reds are not natural trading partners for the Jays is a good one. The Jays do not want to be trading a middle infielder, and would be amenable to trading a catcher. Both clubs see their competitive time as "soon". If you wanted to acquire Votto, a three-way deal would probably be required, with another club acquiring Arencibia or d'Arnaud.
85bluejay - Monday, October 10 2011 @ 04:46 PM EDT (#245672) #

I like Joey Votto very much and he would be a terrific addition to the lineup, but for the price that it's likely to cost - I'd rather try to build a package around Alverez/McGuire/Jenkins for 6 yrs of Eric Hosmer  - I think  that over the next 6 yrs Hosmer will be as productive as Votto (not next year) and will likely cost, generously ,about 50 mil while votto likely will cost over 100 mil - I'd take that extra 50 mil and invest 10 mil annually in IFA/overslot draft picks.Having said all that, my prediction is that the Jays end up with Logan Morrison at 1st, which is great.

johnny was - Monday, October 10 2011 @ 05:02 PM EDT (#245673) #
I very much like the idea of trading for Joey Votto, but would prefer to wait a year from now when he has less value for the Reds with only a year left on his contract.  From a Jays perspective, there are also just too many player development ifs for 2012 to decide whether it would be prudent to make a big, prospect heavy trade for a single star veteran at this juncture.

John Schuerholz had a good record of signing Georgians and other Southern Men to cheaper FA contracts and extensions with the Braves than the market would have dictated and if AA wants to employ a similar strategy with Canadians like Votto, so much the better.
BlueJayWay - Monday, October 10 2011 @ 05:37 PM EDT (#245674) #
Reds GM just today said that they aren't trading him.
Richard S.S. - Monday, October 10 2011 @ 06:05 PM EDT (#245675) #
This http://www.mlbtraderumors.com/2011/10/blue-jays-president-beeston-on.html  will take you here http://thestar.blogs.com/baseball/2011/10/richard-griffin-weve-talked-about-it-a-little-bit-but-watching-the-playoffs-with-all-the-ex-jays-playing-and-the-jays-still.html .   Looks like A.A.'s making some bigger moves this offseason than we thought (Boston, New York And Tampa have more problems than we thought if Beeston is talking about it).
grjas - Monday, October 10 2011 @ 06:08 PM EDT (#245676) #
"Spending a lot of money doesn't guarantee you a playoff spot."...No but it dramatically improves the odds...Top quartile teams were four times- 4X- as likely to make the playoffs as bottom quartile teams....  grjas you should publish this. As far as I'm concerned this is the worst written about topic in the sports pages

Sorry guys. I know I am not supposed to continue a post from another thread, but this is the only time I had a chance to respond to the request in bold above. And the prior thread had finished.

So here is the data. But first the caveats:
. Yeah I know the data is 3 years old but I'm too lazy to update it on a beautiful weekend, and I doubt the conclusions would change
. No I am not proposing that fans of small market teams give up and go home. Exhibit A of course is Tampa
. I purposely did not calculate world series winner data. As we all know, a bounce here and there can win a short series. The more telling data is who wins over 162 games.

The methodology is simple. I sourced salary data off the internet for 14 years- post strike thru the 2008 season. I grouped teams each year by league into 3 pools based on total salaries. then calculated the percentage of teams in each of those pools that made the playoffs. Then averaged it over the 14 years.
Summary data as follows (sorry I can't get (*&(^* tables to work in a post):

Average % teams making the playoffs in each tier

                               AL                  NL               Avg
High                       49%             44%             46%                    
medium                20%              25%            23%
Low                        16%               6%              11%

Average % teams making the playoffs in top and bottom 2

Top 2                       68%            50%              59%
Bottom 2                14%               0%               7%

Conclusions (well mine any way):
. In MLB money buys happiness- top third teams are 4 times more likely to make the playoffs than bottom third. Middle are half as likely as top and twice as likely as bottom
. Top 2 spending teams win over two thirds of the time in AL and 50 percent in NL. Results would be different in NL but for NYM incompetence. Clearly you need a brain attached to all that coin
. The lowest salary team was KC averaging 11.9 out of 14 teams. They didn't make the playoffs. The Yanks averaged 1.1 (only 2nd in salary 1 year in 14) and they made the playoffs 13 out of 14 years
. MLB should be embarrassed by this "class warfare".  They won't Boston/NY games draw significantly more than KC/Toronto

What about the jays?:
. They are middle tier averaging 7.3 (only 1 yrs in bottom tier)
. By the odds they should have made the playoffs 3 times in 14 years. Incompetence? Perhaps but in 6 of 14 years they had the top 2 spending teams in their division
. I hope beeston is serious when he says they'll spend big at the right time. If they don't, odds are they won't sniff the playoffs in the AL east, unless they have incredibly good young, cheap talent...or are incredibly lucky


electric carrot - Monday, October 10 2011 @ 07:41 PM EDT (#245678) #
(soon to be unplugged turnip)
grjas it's great to have these facts at hand.   I agree with your conclusions.  Thanks.
TamRa - Monday, October 10 2011 @ 08:17 PM EDT (#245679) #
I very much like the idea of trading for Joey Votto, but would prefer to wait a year from now when he has less value for the Reds with only a year left on his contract.

I completely agree IF i can be confident the Reds won't deal him elsewhere in the mean time without giving me a shot.


finch - Monday, October 10 2011 @ 09:30 PM EDT (#245680) #
If there are rumors of the Jays landing Votto we know one thing for certain...we are NOT getting Votto. We are more likely to land Alonso. Alonso for someone like Cecil.

The deals that AA makes...no one expects. We all know this.
Nolan - Tuesday, October 11 2011 @ 12:20 AM EDT (#245682) #
Everyone should read the Paul Beeston interview that Richard S.S.linked - very encouraging and one the most information interviews I've read from a front office exec.

Magpie - Tuesday, October 11 2011 @ 12:57 AM EDT (#245683) #
You're making it seem like Gillick dumped McGriff specifically to open a hole for Olerud

Which is certainly not true, although that was definitely a part of the reasoning behind the deal. The Jays hitting talent was badly configured. They had two first basemen and a shortage of outfielders. But the point is that first base is typically the position where talent tends to pile up.
abstractmonkey - Tuesday, October 11 2011 @ 10:44 AM EDT (#245687) #
I'm sure a lot of this stat is indeed luck. But can we separate out parts that are perhaps not luck?

A few easy categories: You could
1) enter the 9th inning with a lead, and then win by one run,
2) enter the 9th with a lead and then lose by one run,
3) enter the 9th by being behind, and then win by one run,
4) enter the 9th by being behind, and then lose by one run.

I suspect that the amount of luck, versus controllable aspects are different in the four categories.

For example, is there any relationship between winning one run games and having a good closer? For category 1, where you enter the 9th with the lead and end up winning the game by one run, having a good closer (or back end bullpen) would increase the number of such wins. It would certainly decrease the number of times for category 2, where you enter the 9th with a lead, and then end up losing by one run. In general, I would suspect having a good closer (which is controllable) would increase your chances of winning one run games (which might not be obvious when looking at the stat as a whole from year to year, but would be more obvious when you look at just the four individual categories).

Also, in terms of the traditional idea of winning one run games being a sign of showing "grittiness", can't this be factored out as well, perhaps by looking at career performance of the offence late in tight games by the current roster? Some players are legitimately better than others in tight spots. That must also influence the number of one run games won.
dan gordon - Tuesday, October 11 2011 @ 01:01 PM EDT (#245693) #
One very important thing to make note of regarding the Pythagoras calculation of expected wins and losses based on runs scored and allowed is that a low scoring team will usually win more games than a high scoring team, if their run differentials are the same.  It's not just a matter of the difference between your runs scored and your runs allowed.  For example, a team that scores 500 runs and allows 400 runs would win on average at a .610 pace.  A team that scores 700 runs and allows 600 runs (the same differential, 100 runs) would win on average at a .576 pace.  That's a big difference in expected wins, 99 vs 93.  In the AL East that could be the difference between finishing in 1st place, and finishing out of the playoffs.  Thus, the importance of improving your pitching and defense should take precedence over improving your hitting.  If you can add 50 runs to your offense or subtract 50 allowed by your pitching and defense, you will gain more wins by doing the latter.  The Jays really need to improve their pitching, and will get more "bang for the buck" than if they try to increase their offense, if the expected amount of improvement is the same. 
Magpie - Tuesday, October 11 2011 @ 01:19 PM EDT (#245694) #
is there any relationship between winning one run games and having a good closer?

No. I've looked!
Magpie - Tuesday, October 11 2011 @ 01:23 PM EDT (#245695) #
In fact, there's very little difference between having the Greatest Closer of all time and having a revolving cast of Ne'er-Do-Wells finishing your games.
Mike Green - Tuesday, October 11 2011 @ 02:39 PM EDT (#245696) #
Dan Gordon, the inference from Pythagorean expectations to optimal strategies is not as straightforward as suggested.  Let's take the 2011 Jays, who scored 743 runs and gave up 761 runs.  It is true that the win expectation would be better if the team scored 743 and gave up 661 runs in 2012 rather than scoring 843 runs and giving up 761 runs, although the marginal difference is nowhere near 6 games.  However, it does not follow that acquiring pitching is more efficient.  There are two problems: first that pitchers only account for about 75% of run prevention and second that there is not likely to be the same availability of talent with the result that the cost of a 10 run improvement may be much higher than a 10 run improvement on offence.  The number of pitchers who can be expected to be 10 runs better than Brandon Morrow or Brett Cecil and who are likely to be available on the market amount to three (by my count)- Darvish, Wilson and Buehrle.  You aren't going to make a 100 run improvement by the acquisition of new pitchers. 

You can make a 100 run improvement  in run prevention with the acquisition of a new pitcher or two, improved defence, and the development of pitching within the organization (hello Morrow, Cecil, Alvarez, Hutchison, Molina and Drabek).  It is however more likely for this club to improve at both ends of the game (given the talent available on the market and on hand).

With respect to the defence, it should be noted that Jose Bautista did not look as good out there in 2011, as he did in previous years.  The numbers suggest that he is a below average defensive right-fielder at this stage.  One option the club has (at some point) is to move him to first base.   


abstractmonkey - Tuesday, October 11 2011 @ 02:53 PM EDT (#245697) #
But there must be a relationship between winning one run games and having a good closer, when only looking at games where the closer enters the game. If you only consider games where the closer pitches, then teams with a good closer will win more than those who don't have a good closer (tautology). And acquiring a good closer (and bullpen) are controllable. Maybe there is a relationship between the SWING stat, and bullpen turnover from year to year?

In general, calling a stat an assessment of "luck" kind of makes me uncomfortable. Things appear random when you don't have enough information about them. Flip a coin a thousand times, you'll get heads about half the time. That's only because we do not have enough information about exactly how we are throwing the coin as we flip it. Get a robot to do it the same way every time, and it will land the same way 100% of the time. But for humans, coin flipping should be considered luck because we can't get and process that information quickly.

So the question is, what is controllable in terms of winning one run games. It will depend on the quality of the bullpen to a large extent (and the GM getting good bullpen help). It maybe that no GM has figured out a relationship (which is why it appears like luck and you get big SWING rates).
92-93 - Tuesday, October 11 2011 @ 03:08 PM EDT (#245698) #
If Bautista's offensive production suffers from the wear and tear of playing RF you absolutely want to move him to 1B. I see this happening if Gose and/or Marisnick are ever good enough for starting jobs during Bautista's contract, pushing Rasmus to a corner spot. Although Bautista thinks he's Willie Mays out there he really isn't all that good an OF; the runs he saves with his arm he gives back with his diminished range and occasionally poor decision making. I wonder how much differently the Jays would view Lind if his 3 arb years weren't under control already for 5m each.
AWeb - Tuesday, October 11 2011 @ 03:13 PM EDT (#245699) #

The problem with one-run games that some people are forgetting is that often, a one-run game results from a bad bullpen performance. Teams blow 4 run leads and win by one. The best closers, since they get 2 and 3 run leads all the time, usually maintain them. So 1-run games are prevented by a good bullpen and closer. A bad closer creates the tension, and then gets credit for escape. Teams often let runners advance at will if they aren't the tying run, which artifically leads to 1-run games when they score a cheap run. A bad closer can "cause" a 1-run game in either direction - blowing a two-three run lead but winning by one, or blowing the game and losing by one. Both performances stink, but one wins, and the other loses, a 1-run game.

Rivera has a reasonable case for best reliever all time, and one can be made for best pitcher of all time (I don't agree, but I think someone here made it pretty well once - Magpie maybe?). He was notably much better than the second best closer, Hoffman. But his SV% is almost exactly the same, because Rivera is overkill for most save situations, where you only need to prevent 2 or more runs from scoring in one inning. A huge part of his greatness has been preventing the existence of 1-run situations in the first place (and a huge part of his career caveat is that he wasn't actually needed to do this).

Bad bullpens lose 1-run leads but also create them. Good bullpens hold one-run leads but prevent them from being created. Especially on good offensive teams, the only way to win more one-run games is to stop trying to score once you are ahead. Defensive replacements probably serve this purpose unintentially, to help the pitching. The only reliable way to create one-run games is to lower the run scoring environment. Here's a question - how did the best teams of the worst offensive eras do in one-run games? Intuitively, they must have done better than random, because not enough runs were scoring to blow teams out as much. Here are a few, all with 50+ 1-run games:

St. Louis 1967: 31-20

St. Louis 1968: 34-28

Detroit 1968: 35-23

Baltimore 1969: 35-21  

Mike Green - Tuesday, October 11 2011 @ 03:16 PM EDT (#245700) #
With regard to the impact of having a great ace reliever, it should be noted that the Yankees have beaten Pythagoras by 45 games total from 1996-2011.  I don't think that is entirely a fluke.  I wonder how they have done home and away vs. Pythagoras during that time.  I suspect that the 9th inning Yankee Stadium strike zone might play a role. 
AWeb - Tuesday, October 11 2011 @ 03:27 PM EDT (#245701) #
That might be an edge effect - since record is only approximated by the formula, it's likely the teams at the edges are the worst approximation. How do KC and Pittsburgh do over the same time period? The Red Sox? I'm not sure where to find that information quickly...
Mike Green - Tuesday, October 11 2011 @ 03:48 PM EDT (#245702) #
The Royals are -35 over the same period, although with generally far below average pens and closers.  The Red Sox are at -1 over the period, with (on average) fair closers- Slocumb, Gordon, Lowe, Urbina, Kim, Foulke and Papelbon.  The Red Sox/Yankee Pythagorean comparison would be a good one. 


bpoz - Tuesday, October 11 2011 @ 04:45 PM EDT (#245703) #
I am having a hard time grasping it all but I think these are great questions. I bow to all who take up the challenge of trying to answer them.

Magpie, when you speak, I just clam up, I am in awe of your abilities. Thank you for all you do. I must find a way to consider the genius of other Bauxites.

I am going to bet half my cuttlefish that the 100 run reduction does indeed beat the 100 run increase in the theory of Pythagoras.
I remember Seattle blowing a huge 7 or 8 run lead to the Jays. The recent 1-0 win by Carp over the Phillies may be luck, I buy that but Man that was great pitching.
Joey M and the Pen could very well have created 1 run wins & losses. In the case of losses the game may have ended when the losing run scored.
Alex Obal - Tuesday, October 11 2011 @ 05:29 PM EDT (#245706) #
I think a lot of people are skating around this point, but nobody's come right out and said it: There's no such thing as a one-run game.
Mike Green - Tuesday, October 11 2011 @ 09:11 PM EDT (#245714) #
Call me old-fashioned, but it's got to be below 10 degrees before I attempt skating. Speaking of which, it would have been a helluva year to make the playoffs what with all those October open dome games. 
Magpie - Wednesday, October 12 2011 @ 02:23 AM EDT (#245720) #
Flip a coin a thousand times,

That's probably it right there! A thousand times. And a season is a small sample.

But the basic truth about one-run games is this: they drag everybody towards .500. Teams that play .700 ball the rest of the time play .560 ball in close games.

Teams that play .600 ball the rest of the time play .540 ball in close games.

But teams that play .300 ball most of the time play .450 ball in close games.

Teams that play .400 ball most of the time play .480 ball in close games.

I have the exact numbers elsewhere (what I've given is accurate to the first two decimals!) I've been threatening to write it all up for the last two years. One of these days!
Chuck - Wednesday, October 12 2011 @ 08:24 AM EDT (#245722) #

Kudos to Magpie for his continued excellence at debunking "common wisdom". In this day of freely available information, clinging to ancient beliefs is willful, unnecessary behaviour. Keep slaying those sacred cows.

With that as a ham-fisted segue, I want to briefly discuss a study Bill James did in 2009 related to the relatonship between pitch counts and strikeouts, a recent topic of conversation in these parts. The study's question was this:

"Suppose that you have a strikeout pitcher and a non-strikeout pitcher, otherwise equal, pitching the same number of innings. How many extra pitches does the strikeout pitcher throw, over the course of a season, because it takes more pitches to get an out by a strikeout?"

I won't pretend to do the study justice -- you can read it yourself in his 2009 Gold Mine and perhaps at his web site -- but I will present a table of data he presented and snippets from his conclusion.

He looked at the top 5 starters on each team in 2007, grouped them into three roughly equal sized buckets based on K rates, and came up with this (the three figures are BB/9, K/9, Pitches/inning):

High K: 3.1, 8.1, 16.3
Med K: 3.0, 6.2, 16.2
Low K: 2.8, 4.6, 15.8

His observations:

"Strikeout pitchers do throw more pitches. But it's minimal, 3 pitches per game in 7 innings, which coincides pretty much with the extra pitches thrown on the 3-4 extra strikeouts those pitchers get.".

"From now on, when I hear somebody say that strikeouts pitchers throw more pitches to get an out, I plan to say, 'That's really not true'".

With the idea that high K pitchers, as a byproduct of their pitching strategy, also walk a lot of batters, and it is those walks that run up their pitch counts, he said:

"Strikeouts do connect to walks, but not really in the modern game... In the modern power vs. power game, it is more true that everybody is playing for strikeouts, and thus that walks simply represent control."


BlueJayWay - Wednesday, October 12 2011 @ 09:11 AM EDT (#245723) #
"From now on, when I hear somebody say that strikeouts pitchers throw more pitches to get an out, I plan to say, 'That's really not true'".

Well, it really is true in a way.  The pitches per out ratio is higher for strikeout pitchers.  However this is balanced by the fact high K pitchers tend to give up fewer hits (because fewer balls in play) so they face fewer batters per inning.  It comes out to about the same pitches/inning.
Chuck - Wednesday, October 12 2011 @ 10:22 AM EDT (#245724) #

Well, it really is true in a way.

I think you are going out of your way to be pedantic here. Clearly James meant strikeout pitchers do not throw more pitches on average per out, not in the specific at-bats that end in outs. But I think you knew that.

BlueJayWay - Wednesday, October 12 2011 @ 10:56 AM EDT (#245725) #
Yes, pitches per out is higher in the ABs that end in outs, because more of them are strikeouts.  What I meant to say is they throw more pitches per plate appearance, but face fewer PA per inning.
Mike Green - Wednesday, October 12 2011 @ 11:09 AM EDT (#245726) #
Chuck, I don't quite get the design of James' study.  If you are comparing high K/low W pitchers with low K/low W pitchers, you are dealing with huge differences in quality of pitching overall.  You would anticipate that the first group would give up fewer hits, have fewer runners on base, and thus have fewer PAs/inning.  If the high strikeout pitchers had a higher rate of P/PA and a lower rate of PA/inning, these two might offset each other.

The real question is whether the population of high strikeout pitchers on major league teams has changed.  Formerly, there would be a significant population of high strikeout, high walk, high upside pitchers (early Koufax, early Randy Johnson, Bobby Witt, Daniel Cabrera...)  Have they, like Joe DiMaggio, gone away?

Chuck - Wednesday, October 12 2011 @ 12:26 PM EDT (#245730) #

I think because it's taken as a given that strikeout pitchers use more pitches -- with some going so far as to suggest they should alter their strategy to "pitch to contact" in an effort to preserve pitches -- James simply wanted to investigate if a high K rate was equivalent to a high pitch count.

Unless I am missing the boat, what I take from his study is that someone like Brandon Morrow is not running up high pitch counts because of his strikeouts, but because of his walks. When Morrow altered his strategy in 2010 (and I'll use May 31 as an arbitrary dividing line), his BB rate dropped from 5.4 to 3.2. What happened to his K rate during this "pitch to contact" transition? It actually rose from 10.4 to 11.3. I can't find his change in pitches/inning before and after the transition, but I imagine they dropped substantially since his IP/GS rose from 5.1 to 5.9.

China fan - Wednesday, October 12 2011 @ 12:39 PM EDT (#245731) #
Morrow averaged 17.35 pitches per inning in 2011, which was significantly worse than any other Jays starter (except Drabek and McGowan).   Romero was at exactly 15 pitches per inning, and Cecil was at 15.49 pitches per inning.  So the difference between Morrow and those two, over 7 innings, would be 14 additional pitches -- a lot more than the 3 pitches cited by James.  Of course this doesn't necessarily contradict James at all, since Morrow is not necessarily a prototypical strikeout pitcher -- his walk rate is too high for that.
Mike Green - Wednesday, October 12 2011 @ 01:39 PM EDT (#245737) #
Oh.  I wouldn't suggest that strikeout pitchers "pitch to contact".  However, if the effort to strike out hitters is leading to more 3-2 counts and more walks, there is a trade-off. 
Mick Doherty - Wednesday, October 12 2011 @ 03:04 PM EDT (#245745) #

The real question is whether the population of high strikeout pitchers on major league teams has changed.  Formerly, there would be a significant population of high strikeout, high walk, high upside pitchers (early Koufax, early Randy Johnson, Bobby Witt, Daniel Cabrera...)  Have they, like Joe DiMaggio, gone away?

Where have you gone, Bobby Witt, oh no  ...
Have you and Unit left and gone away?
Hey hey hey ... K-K-K ....

Dibble and Koufax, where'd they go?
Danny Cabrera, why couldn't you stay?
Hey hey hey ... K-K-K ....


Chuck - Wednesday, October 12 2011 @ 03:43 PM EDT (#245747) #
Morrow's 2011 featured a 3.5 BB/9 and 10.2 K/9, slotting him nicely into the top rung of James' groupings. His 17.3 pitches per inning has him 1 pitch/inning higher than that rung's average (or at least the 2007 average). I imagine his ridiculously low GIDP rate was a key contributor to his extra pitches. And his wild pitch count was high, reducing those GIDP opportunities.

He's a tough one to figure. After taking control of his HR rate in 2010, it returned to something more normal for him in 2011. Whether the increased HR/9 and the decreased BB/9 have anything to do with each other, I don't know. Was he so fearful of walks that he elected instead to "challenge hitters"? Confusing causation and correlation is an easy trap to fall into, so I'll avoid speculating.

His most problematic split continues to be related to men on base. His splits for nobody-on/men-on/RISP:

career: 657/778/796
2011: 632/811/888

In 2011, his gap was larger than usual, and his deterioration with RISP was worse yet. Is this an anomoly? The result of some psychological effects? A physical difference between pitching from the stretch and from the wind-up? Good thing there are paid professionals around to try to sort this stuff out. Maybe an adjustment to his mechanics in the stretch is in order. Maybe he needs his chakras realigned. Or maybe he needs to toss a virgin into a volcano to appease Fortuna.
Mike Green - Wednesday, October 12 2011 @ 04:04 PM EDT (#245749) #
It would be useful to have a pitch fx analysis of the two Morrows (no pun intended).
Chuck - Wednesday, October 12 2011 @ 04:33 PM EDT (#245751) #

Who are you, Macbeth? To-morrow, and to-morrow, and to-morrow...

Never mind, that's three Morrows. You only mentioned two. Carry on.

Perchance the sun will come out to Morrow?

(The perils of skipping lunch. There appears to be a sugar level drop in effect here.)


Dewey - Wednesday, October 12 2011 @ 04:46 PM EDT (#245755) #
 Flip a coin a thousand times, you'll get heads about half the time. That's only because we do not have enough information about exactly how we are throwing the coin as we flip it.  Get a robot to do it the same way every time, and it will land the same way 100% of the time. But for humans, coin flipping should be considered luck because we can't get and process that information quickly.

Exactly.  And as long as humans rather than robots continue to play baseball,  all the stats in the world will never allow us to “understand” the mysteries of baseball.   Or predict them.  For which much thanks.
bball12 - Wednesday, October 12 2011 @ 05:01 PM EDT (#245758) #
Ah the mysteries of baseball. In true 1 run games - mysteries like taking a walk, getting the runner moved over and making the defensive play. None of which has been mentioned much but nevertheless as important as ever.
Mick Doherty - Wednesday, October 12 2011 @ 05:01 PM EDT (#245759) #

Perchance the sun will come out to Morrow?

Bet your bottom dollar on TO/s Morrow ...


Mike Green - Wednesday, October 12 2011 @ 05:10 PM EDT (#245760) #
When the night meets your breaking ball
Will you still love me too, Morrow?

abstractmonkey - Friday, October 14 2011 @ 01:40 AM EDT (#245794) #
Baseball is indeed far too complex to fully understand. That said, there are some things we can learn even if they appear as luck. If an alien watched a season of baseball, they might say that hitters get a hit on average 25% of the time, and after that it's just luck. But we've figured out all kinds of better predictors than that. We've figured out that some hitters consistently do better than others, we've figured out percentages based on if the hitter/pitcher is right/left handed, and obviously much more. So we can still figure things out. I'm just saying that just because it appears as luck doesn't mean it is, and we can likely figure it out better.

And in this case, it is definitely true that we can figure it out better. As I said earlier, if you only consider games where the closer enters the game, teams with a good closer will do better. Just that one case right there shows it. You can separate that one case out and get something closer to the real "lucky part". But stopping somewhere and saying "the rest is luck" is not so easy.
bpoz - Friday, October 14 2011 @ 10:16 AM EDT (#245799) #
I have been meaning to ask questions to understand Saves fully.

Definition: Basically the lead has to be 3 runs or less, unless the pitcher pitches 3+ innings then the lead can be any size. Correct?

Only the last pitcher gets the Save the others get a Hold for protecting a lead.

It gets confusing to me if the lead keeps changing hands. A relief pitcher #1 comes in and gives up the lead in any inning 1st to... He pitches 4 innings and gives up the lead each time that his team provided for him in their AB so he has 4 Blown Saves in that game. Which makes that part of his stats and the pen's overall stats look bad, regarding BSs. OR 4 RPs all do the same thing and the pen still gets charged with 4 BSs.

Looking that the Stats page, the Holds number is not mentioned which seems unfair to me.
It always bothered me that Zep blew all 3 of his SVOs because it was the only bad thing on his record IMO.
James W - Friday, October 14 2011 @ 10:39 AM EDT (#245800) #
You have a save opportunity if the lead is 3 or less, or if the tying run is on deck. (So you can get a save if you come into a 5-run game with the bases loaded.)

You get a blown save if you come into a game during a save opportunity, and give up the lead while you're in the game.

You get a save if you come into the game during a save opportunity, and end the game. Or if you pitch the last 3+ innings as mentioned.

In your example, if a relief pitcher blows 4 leads (why wasn't he pulled before?) he could get a blown save for the first lead, but after that he's no longer in a save opportunity, so he can't blow any more saves. If 4 RPs each blow leads, yes they can all get blown saves.

Holds can be found on most sites. As for being bothered about how relief pitching works, that's just how it is. If you aren't the guy who finishes games with save opportunities, then there's not many mainstream stats that show how you've contributed.
Chuck - Friday, October 14 2011 @ 01:44 PM EDT (#245805) #

Which makes that part of his stats and the pen's overall stats look bad, regarding BSs.

Even ignoring that blown saves by closers are not all of the same magnitude (blowing a 1-run lead is different than blowing a 3-run lead), the whole notion of blown saves is entirely meaningless for anyone other than closers.

Why should a pitcher get charged with a blown save in the 7th inning when he wasn't even brought into the game to save it in the first place? That should probably be called a blown hold. Is there even such a thing?

If a save must go to the last pitcher of the game (if he qualifies) then a blown save should only ever be charged to the last pitcher of the game.

Jason Frasor had 0 saves and 2 blown saves in 2011. What does that mean?

Mike Green - Friday, October 14 2011 @ 02:14 PM EDT (#245806) #
I guess that there was a game when Jo-Jo Reyes (starting pitchers names may be changed to protect the innocent) threw 5 innings against Boston and led 8-6 when he was taken out for Shawn Camp who gave up a homer in the sixth to make it 8-7.  Jason Frasor then threw a perfect 7th and gave up a solo homer to Adrian Gonzalez in the eighth to tie the game and retired the side.  Jason Frasor is charged with a blown save because it is truly shocking that Jo-Jo Reyes did not get the win. Somebody must be blamed for it, and you cannot blame the offence for not scoring a run in the 6th-8th innings, and you cannot blame Shawn Camp. 

Leaving the vortex of sarcasm for a moment, the whole win/save/blown save/hold statistical package is just a waste of bandwidth. 
bpoz - Friday, October 14 2011 @ 06:40 PM EDT (#245810) #
Thanks for responding James W, Chuck & M Green.

Lets say the overall purpose is to build a pen. The Jays & TB added quite a few bodies for 2011, but Boston, Detroit and others may have added only 1 or 2. And AA did a great job helping the St Louis GM rebuild his pen with our 2 RPs plus who E Jax replaced. StL fans remember that when Rasmus is an All Star.

Mike, you are probably right about it being a waste of band width.
You are a softie Chuck, you say unfair? just Kidding.
James W, pull him before he blows 4 leads, sounds good. However if bases loaded none out, 2 pitches, double play & popup up, his BS other guys ER. He could pitch 2 more innings scoreless or 1 run given up earned or unearned.
I only want to build a pen, a good one.

We got Carlos V cheap. His numbers in MIL looked good his last 2 seasons except for the ERA, but 1 horrible game can hurt the ERA. I was wrong in thinking that he should not make the team out of ST due to his past performance numbers but there is more to it than numbers. I expected him to crap out. Happy to be mistaken.


Magpie - Saturday, October 15 2011 @ 04:27 AM EDT (#245816) #
we can likely figure it out better.

Well, in the case of close games, we have. The better the team, the less impressive their record in close games is likely to be. The worse the team, the better their record in close games is likely to be. Close games drag everybody towards .500, towards the centre. I think the reason for this is because in close games, the impact of random chance - i.e. luck - is powerful enough to overwhelm the impact of talent. But if anyone has a better explanation for why the good teams play worse and the bad teams play better...
bpoz - Saturday, October 15 2011 @ 09:24 AM EDT (#245819) #
Another possibility that may also be wrong.

In a close game, that is in the late innings, some managers may think of pinch hitting as a strategy ie use a better hitter. So would a balanced HR hitting team like the 2010 Jays have more success in 1 run games. I believe my logic makes sense, the line up is full of HR hitters. If Matt Stairs was on the bench IMO it would not hurt either.

I know that you need more than just HRs for a good overall offense, in a long season.
Alex Obal - Saturday, October 15 2011 @ 03:01 PM EDT (#245822) #
I think the reason for this is because in close games, the impact of random chance - i.e. luck - is powerful enough to overwhelm the impact of talent. But if anyone has a better explanation for why the good teams play worse and the bad teams play better...

If it helps, you can think of close games as short games. When a game is tied 0-0 in the top of the first, the Royals have to beat the Yankees for nine innings to win. When a game is tied at the end of the 7th, the Royals only have to beat the Yankees for two innings. There is less time for the talent to overwhelm the randomness. (Talent is the unstoppable force, randomness is the immovable object.) If you'd actually give me even money odds on the Yankees winning the two-inning game, that is really dumb, and I will take the bet every single time. But the Royals are more likely to win a two-inning game than a nine-inning game...
Mike Green - Saturday, October 15 2011 @ 04:40 PM EDT (#245823) #
There is another factor.  Home teams tend to win a much greater percentage of one-run games than away teams.  The walk-off rule inclines teams to home teams to win by one run rather than two or more; for instance, if an away team in a tie game in the ninth has the bases loaded and nobody out, and the next batter hits a liner up the gap, three runs may score and the club will probably win by two runs or more whereas if this happens in the bottom of the ninth, it's a one-run win.  There may also be issues with more favourable calls late by umpires for home teams. 
In any event, the Blue Jays in 2011 were 18-9 at home in one-run games and 11-18 on the road in one-run games, according to my hand count.  My guess is that this might be a somewhat high differential for a club in a season.  Because every team gets to play at home and away equally often, there is an equalizing force in one-run games greater than the usual home field advantage  For fun, I checked the Orioles, a bad team who went 22-22 in one-run games.  That broke down as 13-9 at home and 9-13 on the road (they were 39-42 at home and 30-51 on the road). 

Unfortunately, BBRef doesn't appear to have a league-wide home/road split in one-run games. 

BlueJayWay - Saturday, October 15 2011 @ 05:11 PM EDT (#245824) #
the Blue Jays in 2011 were 18-9 at home in one-run games

Wow if that's true I was really unlucky.  I went to four games this year.  They went 0-4, losing each of the last three by one run.
The Year in Review I - What Pythagoras Says | 98 comments | Create New Account
The following comments are owned by whomever posted them. This site is not responsible for what they say.