


It's one of my favourite plays in baseball.
And it's always a big play. When an outfielder throws out someone, at a minimum he's turning an opposition base runner into an out. He's not retiring a hitter, he's removing someone who's already reached base and is therefore a threat to score. When an outfielder throws out a runner at home plate, it's the next best thing to actually taking a run off the scoreboard.
As it happens, the Blue Jays once employed the man who may well have possessed the finest outfield arm ever. Ever. In the history of the game. Not enough people understand this, and while we all knew while we were watching him play that Jesse Barfield had a remarkable arm, I don't think we fully understood quite how historically great he was.
In the updated edition of his Historical Baseball Abstract, Bill James presents the following little Data Table
It's simply a chart of BaseRunner Kills per 1000 innings (about 111 games). The list is confined to men born in the 20th century. This is sadly necessary. Outfielders who played before 1920 were able to throw out many, many more baserunners than a modern outfielder. With the scuffed dirty baseballs, and opposing hitters simply trying to put the ball in play, they could play much shallower than a modern outfielder. They could play shallow enough to field a ground ball and get the force at second base. Tris Speaker (449 career BaseRunner Kills, approximately 20 per 1000 innings) did it all the time. So you have to draw a line to eliminate all those outfielders active before 1920. It's too bad - one would like to know how Speaker would stack up under modern conditions (pretty damn well, I'm thinking - he was Tris Speaker, after all). Unfortunately this also counts out Bob Meusel, who was active after the Ruth Revolution but born in 1896. Meusel was universally regarded as having the best outfield arm of his time (the 1920s). Had he been listed here he would have come in third, just behind Klein and Barfield.
And as for Chuck Klein, there's something we need to know about his home field. This is the Baker Bowl in Philadelphia:
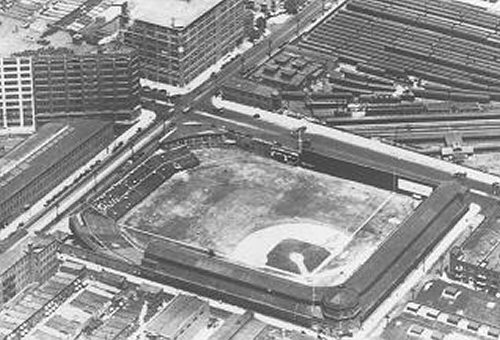
The right field line was just 270 feet from home plate, and the wall itself was 40 feet high - higher than the Green Monster in Fenway, with a 20 foot high screen on top. The Phillies right-fielder played much, much closer to the infield than any modern outfielder. A modern right fielder takes up a position shading towards the right-centre alley - he's about 270 feet from home plate, and at least 75 feet from the wall. If Klein took up a position just 40 feet in front of the wall - well, he may have had a shorter throw to first base than the third baseman.
Klein did spend two seasons with the Cubs, and did enough to demonstrate that he did indeed have a good arm - with Chicago he threw out 20 runners in about 2145 innings - a rate of 9.32 per 1000 innings. But as a Phillie, Klein threw out 174 runners in about 11,583 innings - 15.02 per 1000 innings. There's obviously a pretty massive park illusion to account for here.
Klein's BaseRunner Kill rate as a Cub is a little bit better than Vladimir Guerrero's (Vlad is at 9.3 per 1000) and quite a bit better than Ichiro Suzuki's (7.0 per 1000). He's not quite as good as Larry Walker (10.3 per 1000). Klein had a fine arm, obviously. But Barfield's was much, much better. None of these other guys are even close to Barfield.
Only one current outfielder, by the way, active in the years since James published his book, is in a position to carve out a place on this list. That's Jeff Francoeur of the Braves, who has 56 BaseRunner Kills in just 4,632 innings. At 11.9 per 1000, he'd just edge John Callison off the Top 10.
One of the things that got me interested in looking into the subject was a passing remark made by Mike Green (I think - was it you, Mike?). Oddly enough, the subject had very little to with outfielders. Under discussion were the respective strengths and weaknesses of the Jays' two catchers, and I remember Mike (I think!) saying something to the effect that while Barajas had a better arm, Zaun was better at blocking the plate. And I thought - okay, that may be true, but for some reason I think Barajas is much better than Zaun at catching the long throw and making a play. So I was going to look into BaseRunner Kills at home plate, and find out how often each catcher was involved.
Well, I didn't do that! Sorry! I need to wait until the season is in the books, and Retrosheet gets updated! But I still wanted to find out where BaseRunner Kills happen. So I did, for the Blue Jays outfielders, anyway. And that brings us to our Data Tables!
Now it would have been fun to make these tables complete, just so you can chuckle at the very weird names you'd find at the bottom of these llists. Garth Iorg and Willie Upshaw in centre field? Yes, that happened. Domingo Cedeno and Dave Stieb in left? Who could forget! Manuel Lee and Dave Collins in right? You're chuckling right now, aren't you.
But alas - it simply ain't worth the bother to format all those zeroes. So we'll stick with the 15 men who played the most at each of the three outfield positions.
These are the numbers for their careers as a Blue Jay. I've just sorted them by innings played. The final four columns give you which base each of these BaseRunner Kills seems to have taken place at (occasionally it's hard to decide!), along with the rate of BKs per 1000 innings.
First the left fielders:
Of the men who spent a decent amount of time in left, the two who threw out baserunners most frequently were Otto Velez in extremely limited time and Dave Collins. Dave Collins, of course, didn't throw very well at all. However, Collins had exceptional speed and outfielders with great speed often are able to throw out a great many base runners - they get to balls the runner does not expect him to reach, or they get to the ball much more quickly than the runner expects. Omar Moreno, the old Pirate and Yankee centre fielder (affectionately remembered as "Omar the Out-Maker"), had one of the weaker throwing arms of his time but in 1980 he managed more BaseRunner Kills than his teammate Dave Parker. In 1984, by then a Yankee, Moreno threw out three times as many baserunners as his teammate Dave Winfield, in considerably less playing time. Parker and Winfield, of course, were widely (and justifiably) regarded as having among the very finest throwing arms in the game while they were active. But this happens, and it's not to be mocked - the BaseRunner Kill is a Big Play, always, and whether it's the speed of the leg or the strength of the arm that makes it possible doesn't much matter.
It's also true, of course, that runners didn't exactly hesitate before challenging the arms of Collins or Moreno.
The distribution by base for outs recorded is quite similar for left fielders and right fielders. The main difference is that left fielders don't get as many of their BaseRunner Kills at third base, which means that second base and home account for a somewhat larger proportion of their total BaseRunner Kills. This is mainly because nobody goes first to third on a ball that lands in front of a left fielder. Blue Jays left fielders have thrown out 17 men at first (5.5%), 129 at second (41.9%), 61 at third (19.8%), and 118 at home (38.3%). George Bell's numbers are quite typical - Shannon Stewart got a somewhat larger than expected share of his BaseRunner Kills at home, and I'll bet there was an outstanding relay from Alex Gonzalez on at least half of them.
And of course left fielders don't throw out nearly as many baserunners overall, because left field is where you put the guy who doesn't throw very well.
It's a little surprising to see how poorly Joe Carter does, although we may be seeing a small sample size effect as well as the fact that as he threw well enough to play right field, and posted quite decent numbers in this respect as a right fielder.) It may have been sufficient to discourage enemy baserunners from going for the extra base with the same abandon that they would have had if Stewart or Nixon was fielding the ball.
And in centre, we have:
This also helps account for the tremendous showing given here by Rick Bosetti, who was indeed a fine defensive player who ran and threw well, and also had no shortage of runners to try to erase.
Uniquely among the three outfield positions is the fact that centre fielders throw out roughly the same number of people at second base, third base, and home plate. This is not true for the other two outfield positions, as we've already seen for the left fielders. But as a group, Blue Jays centre-fielders have thrown out 17 men at first (6.4%), 96 at second (36.2%), 87 at third (32.8%), and 82 at home (30.9%).
Finally, in right:
Barfield, of course, has the best career numbers of the men who played a few hundred games here. By a mile, and then some. While Barfield ran well enough to play centre field, Jesse's special gift was the strength and accuracy of his arm, and his remarkable totals on the long throws, to third and home, testifies to that. He completely blows away Raul Modesi, who did a very good job of throwing out enemy baserunners while he was a Blue Jay - Mondesi's 9.6 BaseRunner Kills per 1000 innings is excellent (slightly better than his career average of 9.0 per 1000 innings). It's better than Vlad, better than Ichiro, better than almost any active outfielder in the game today.
Overall, Toronto right fielders have thrown out 39 men at first base (9.8%), 157 (39.6%) at second. 93 (23.5%) at third , and 146 (36.9%) at home. Almost all BaseRunner Kills at first base are the second half of a double play - a runner in motion gets doubled off when the outfielder catches the ball in the air. I noticed only once a Jays outfielder throwing out the batter at first base, the old 9-3 groundout - it was Orlando Merced, by the way, although it's possible I missed another one or two. Anyway, right fielders make this play far more often, simply because they're much closer to first base - Barfield, with his combination of speed and arm strength naturally makes this play more often than anyone else as well.
Finally, here are the single season numbers for each outfield position. This list actually has some pretensions to completeness - it includes everyone who played at least 70 games at one of the three outfield spots in a season, and the seasons are ranked in order of Frequency of BaseRunner Kills.
And it's always a big play. When an outfielder throws out someone, at a minimum he's turning an opposition base runner into an out. He's not retiring a hitter, he's removing someone who's already reached base and is therefore a threat to score. When an outfielder throws out a runner at home plate, it's the next best thing to actually taking a run off the scoreboard.
As it happens, the Blue Jays once employed the man who may well have possessed the finest outfield arm ever. Ever. In the history of the game. Not enough people understand this, and while we all knew while we were watching him play that Jesse Barfield had a remarkable arm, I don't think we fully understood quite how historically great he was.
In the updated edition of his Historical Baseball Abstract, Bill James presents the following little Data Table
                      BK   Innings  Rate
Chuck Klein          195   13,740   14.2
Jesse Barfield       162   11,547   14.0
Roy Cullenbine       100    7,268   13.8
Bob Johnson          208   15,302   13.6
Mel Ott              257   20.043   12.8
Roberto Clemente     266   20.755   12.8
Paul Waner           247   19,887   12.4
Ben Chapman          159   12,994   12.3
Dom DiMaggio         147   12,089   12.2
John Callison        175   14,997   11.7
It's simply a chart of BaseRunner Kills per 1000 innings (about 111 games). The list is confined to men born in the 20th century. This is sadly necessary. Outfielders who played before 1920 were able to throw out many, many more baserunners than a modern outfielder. With the scuffed dirty baseballs, and opposing hitters simply trying to put the ball in play, they could play much shallower than a modern outfielder. They could play shallow enough to field a ground ball and get the force at second base. Tris Speaker (449 career BaseRunner Kills, approximately 20 per 1000 innings) did it all the time. So you have to draw a line to eliminate all those outfielders active before 1920. It's too bad - one would like to know how Speaker would stack up under modern conditions (pretty damn well, I'm thinking - he was Tris Speaker, after all). Unfortunately this also counts out Bob Meusel, who was active after the Ruth Revolution but born in 1896. Meusel was universally regarded as having the best outfield arm of his time (the 1920s). Had he been listed here he would have come in third, just behind Klein and Barfield.
And as for Chuck Klein, there's something we need to know about his home field. This is the Baker Bowl in Philadelphia:
The right field line was just 270 feet from home plate, and the wall itself was 40 feet high - higher than the Green Monster in Fenway, with a 20 foot high screen on top. The Phillies right-fielder played much, much closer to the infield than any modern outfielder. A modern right fielder takes up a position shading towards the right-centre alley - he's about 270 feet from home plate, and at least 75 feet from the wall. If Klein took up a position just 40 feet in front of the wall - well, he may have had a shorter throw to first base than the third baseman.
Klein did spend two seasons with the Cubs, and did enough to demonstrate that he did indeed have a good arm - with Chicago he threw out 20 runners in about 2145 innings - a rate of 9.32 per 1000 innings. But as a Phillie, Klein threw out 174 runners in about 11,583 innings - 15.02 per 1000 innings. There's obviously a pretty massive park illusion to account for here.
Klein's BaseRunner Kill rate as a Cub is a little bit better than Vladimir Guerrero's (Vlad is at 9.3 per 1000) and quite a bit better than Ichiro Suzuki's (7.0 per 1000). He's not quite as good as Larry Walker (10.3 per 1000). Klein had a fine arm, obviously. But Barfield's was much, much better. None of these other guys are even close to Barfield.
Only one current outfielder, by the way, active in the years since James published his book, is in a position to carve out a place on this list. That's Jeff Francoeur of the Braves, who has 56 BaseRunner Kills in just 4,632 innings. At 11.9 per 1000, he'd just edge John Callison off the Top 10.
One of the things that got me interested in looking into the subject was a passing remark made by Mike Green (I think - was it you, Mike?). Oddly enough, the subject had very little to with outfielders. Under discussion were the respective strengths and weaknesses of the Jays' two catchers, and I remember Mike (I think!) saying something to the effect that while Barajas had a better arm, Zaun was better at blocking the plate. And I thought - okay, that may be true, but for some reason I think Barajas is much better than Zaun at catching the long throw and making a play. So I was going to look into BaseRunner Kills at home plate, and find out how often each catcher was involved.
Well, I didn't do that! Sorry! I need to wait until the season is in the books, and Retrosheet gets updated! But I still wanted to find out where BaseRunner Kills happen. So I did, for the Blue Jays outfielders, anyway. And that brings us to our Data Tables!
Now it would have been fun to make these tables complete, just so you can chuckle at the very weird names you'd find at the bottom of these llists. Garth Iorg and Willie Upshaw in centre field? Yes, that happened. Domingo Cedeno and Dave Stieb in left? Who could forget! Manuel Lee and Dave Collins in right? You're chuckling right now, aren't you.
But alas - it simply ain't worth the bother to format all those zeroes. So we'll stick with the 15 men who played the most at each of the three outfield positions.
These are the numbers for their careers as a Blue Jay. I've just sorted them by innings played. The final four columns give you which base each of these BaseRunner Kills seems to have taken place at (occasionally it's hard to decide!), along with the rate of BKs per 1000 innings.
First the left fielders:
	Player	  POS	G    INN   PO   BK  ERR  DP    PCT   1b  2b  3b	Home   BK per 1000

 1 George Bell	   LF  963  8279  1804  68   71  10   .963    3  31  10  25	 8.2
 2 Shannon Stewart LF  698  5909  1346  26   23   4   .984    1   8   6  11	 4.4
 3 Al Woods	   LF  523  4290  1072  30   30   5   .973    1  15   7   7	 7.0
 4 Joe Carter	   LF  389  3201   686  15   26   2   .964    2   4   4   5	 4.7
 5 Reed Johnson	   LF  398  2516   541  20    5   1   .991    0   8   7   5	 8.0
 6 F. Catalanotto  LF  314  2290   461  19    3   4   .994    3   6   4   6	 8.3
 7 Dave Collins	   LF  217  1709   435  16    5   4   .989    0   6   5   5	 9.4
 8 Candy Maldonado LF  207  1704   377  15    8   1   .980    0   7   3   5	 8.8
 9 Jose Cruz	   LF  183  1497   349  13    3   4   .992    0   3   1   8	 8.7
10 Barry Bonnell   LF  173  1085   263   7    4   0   .985    2   3   1   1	 6.5
11 Adam Lind	   LF   82   668   141   5    0   0  1.000    0   3   1   1	 7.5
12 Otto Velez	   LF   82   540   139   8    6   3   .961    0   4   0	  4	14.8
13 Robert Perez	   LF   83   509   118   3    2   0   .984    0   1   1   1	 5.9
14 Mookie Wilson   LF   60   488   112   2    3   0   .974    0   1   1   0	 4.1
15 Carlos Delgado  LF   58   454    90   3    2   0   .979    0   2   0   1	 6.6
Of the men who spent a decent amount of time in left, the two who threw out baserunners most frequently were Otto Velez in extremely limited time and Dave Collins. Dave Collins, of course, didn't throw very well at all. However, Collins had exceptional speed and outfielders with great speed often are able to throw out a great many base runners - they get to balls the runner does not expect him to reach, or they get to the ball much more quickly than the runner expects. Omar Moreno, the old Pirate and Yankee centre fielder (affectionately remembered as "Omar the Out-Maker"), had one of the weaker throwing arms of his time but in 1980 he managed more BaseRunner Kills than his teammate Dave Parker. In 1984, by then a Yankee, Moreno threw out three times as many baserunners as his teammate Dave Winfield, in considerably less playing time. Parker and Winfield, of course, were widely (and justifiably) regarded as having among the very finest throwing arms in the game while they were active. But this happens, and it's not to be mocked - the BaseRunner Kill is a Big Play, always, and whether it's the speed of the leg or the strength of the arm that makes it possible doesn't much matter.
It's also true, of course, that runners didn't exactly hesitate before challenging the arms of Collins or Moreno.
The distribution by base for outs recorded is quite similar for left fielders and right fielders. The main difference is that left fielders don't get as many of their BaseRunner Kills at third base, which means that second base and home account for a somewhat larger proportion of their total BaseRunner Kills. This is mainly because nobody goes first to third on a ball that lands in front of a left fielder. Blue Jays left fielders have thrown out 17 men at first (5.5%), 129 at second (41.9%), 61 at third (19.8%), and 118 at home (38.3%). George Bell's numbers are quite typical - Shannon Stewart got a somewhat larger than expected share of his BaseRunner Kills at home, and I'll bet there was an outstanding relay from Alex Gonzalez on at least half of them.
And of course left fielders don't throw out nearly as many baserunners overall, because left field is where you put the guy who doesn't throw very well.
It's a little surprising to see how poorly Joe Carter does, although we may be seeing a small sample size effect as well as the fact that as he threw well enough to play right field, and posted quite decent numbers in this respect as a right fielder.) It may have been sufficient to discourage enemy baserunners from going for the extra base with the same abandon that they would have had if Stewart or Nixon was fielding the ball.
And in centre, we have:
Player POS G INN PO BK ERR DP PCT 1b 2b 3b Home BK per 1000This is our first encounter with the wonder of Bob Bailor, whose ability to rack up the BaseRunner Kills was quite otherworldly. Bailor spent four seasons in Toronto, and played all three outfield positions - he was more or less the regular right-fielder in 1979 and 1980, and a super-sub the rest of the time. He also accumulated a little more than 100 games in centre, although he never played more than 47 games there in a single season. Bailor had both of the ingredients that help a fielder throw out baserunners: a strong, accurate arm and good speed. He also had a couple of things going for him that Jesse Barfield, say, didn't have. One was the element of surprise - for more than half of his games as an outfielder, he was a guy filling in rather than the regular. Backups on terrible teams don't carry reputations around the league. The other factor, of course, was that the opposition during the years 1977 through 1980 had a zillion baserunners, advancing merrily from base to base. The Law of Large Numbers says you're going to throw some of them out - there were days when it was more likely than the pitcher retiring a hitter.
1 Lloyd Moseby CF 1222 10436 3087 52 46 8 .986 3 23 13 13 5.0
2 Vernon Wells CF 945 8131 2178 45 16 9 .993 3 16 11 15 5.5
3 Devon White CF 650 5631 1809 33 20 7 .989 2 12 11 8 5.9
4 Jose Cruz CF 520 4460 1219 26 14 4 .989 3 7 8 8 5.8
5 Rick Bosetti CF 361 3109 1040 38 21 5 .981 1 13 15 9 12.2
6 Otis Nixon CF 227 1971 595 6 3 2 .995 1 1 4 0 3.0
7 Mookie Wilson CF 160 1405 406 6 3 3 .993 0 2 1 3 4.3
8 Barry Bonnell CF 141 1089 314 8 9 2 .973 0 5 1 2 7.3
9 Bob Bailor CF 105 834 266 14 9 7 .969 0 2 6 6 16.8
10 Shannon Stewart CF 109 825 221 4 5 1 .978 0 1 1 2 4.8
11 Jacob Brumfield CF 98 736 213 6 4 0 .982 0 1 2 3 8.1
12 Gary Woods CF 61 510 160 5 1 0 .994 0 0 3 2 9.8
13 Junior Felix CF 52 444 120 6 1 2 .992 2 2 1 1 13.5
14 Reed Johnson CF 64 440 115 3 0 1 1.000 1 0 2 0 6.8
15 Jesse Barfield CF 65 414 139 7 1 3 .993 0 1 2 4 16.9
This also helps account for the tremendous showing given here by Rick Bosetti, who was indeed a fine defensive player who ran and threw well, and also had no shortage of runners to try to erase.
Uniquely among the three outfield positions is the fact that centre fielders throw out roughly the same number of people at second base, third base, and home plate. This is not true for the other two outfield positions, as we've already seen for the left fielders. But as a group, Blue Jays centre-fielders have thrown out 17 men at first (6.4%), 96 at second (36.2%), 87 at third (32.8%), and 82 at home (30.9%).
Finally, in right:
Player POS G INN PO BK ERR DP PCT 1b 2b 3b Home BK per 1000Bailor, again - while his work often gathers a bunch of small samples, in 1979 he played 113 games in RF and gunned down 15 baserunners. Barfield himself only tops that rate of eliminating baserunners once. Bailor's most remarkable performance came in one of his small sample seasons - in 1980, he threw out 6 baserunners from right field in just 208 innings, which is beyond phenomenal.
1 Jesse Barfield RF 957 7776 1987 110 41 36 .981 11 38 20 41 14.1
2 Shawn Green RF 569 4681 1130 43 17 14 .986 4 17 9 13 9.2
3 Alexis Rios RF 517 4202 923 35 10 8 .990 1 9 6 19 8.3
4 Joe Carter RF 440 3775 839 33 17 5 .981 3 13 10 7 8.7
5 Raul Mondesi RF 307 2700 583 26 17 5 .973 3 10 5 8 9.6
6 Bob Bailor RF 250 1942 491 32 10 8 .981 2 9 11 10 16.5
7 Junior Felix RF 185 1561 370 14 16 1 .960 1 7 3 3 9.0
8 Reed Johnson RF 197 1475 304 12 5 2 .984 0 6 4 2 8.1
9 Barry Bonnell RF 160 1225 285 14 7 2 .977 1 5 4 4 11.4
10 Otto Velez RF 152 1169 286 10 5 3 .983 1 4 1 4 8.6
11 Lloyd Moseby RF 112 939 228 8 3 0 .987 1 4 0 3 8.5
12 George Bell RF 114 886 209 6 5 2 .977 0 1 1 4 6.8
13 Orlando Merced RF 96 827 190 10 3 4 .985 3 4 1 2 12.1
14 Rick Leach RF 98 600 137 3 2 0 .986 1 1 0 1 5.0
15 Hosken Powell RF 98 597 160 2 3 0 .982 0 1 0 1 3.3
Barfield, of course, has the best career numbers of the men who played a few hundred games here. By a mile, and then some. While Barfield ran well enough to play centre field, Jesse's special gift was the strength and accuracy of his arm, and his remarkable totals on the long throws, to third and home, testifies to that. He completely blows away Raul Modesi, who did a very good job of throwing out enemy baserunners while he was a Blue Jay - Mondesi's 9.6 BaseRunner Kills per 1000 innings is excellent (slightly better than his career average of 9.0 per 1000 innings). It's better than Vlad, better than Ichiro, better than almost any active outfielder in the game today.
Overall, Toronto right fielders have thrown out 39 men at first base (9.8%), 157 (39.6%) at second. 93 (23.5%) at third , and 146 (36.9%) at home. Almost all BaseRunner Kills at first base are the second half of a double play - a runner in motion gets doubled off when the outfielder catches the ball in the air. I noticed only once a Jays outfielder throwing out the batter at first base, the old 9-3 groundout - it was Orlando Merced, by the way, although it's possible I missed another one or two. Anyway, right fielders make this play far more often, simply because they're much closer to first base - Barfield, with his combination of speed and arm strength naturally makes this play more often than anyone else as well.
Finally, here are the single season numbers for each outfield position. This list actually has some pretensions to completeness - it includes everyone who played at least 70 games at one of the three outfield spots in a season, and the seasons are ranked in order of Frequency of BaseRunner Kills.
Player POS G INN PO A ERR DP PCT 1b 2b 3b Home BK per 1000Happy birthday, Liam! You da Man!
2006 F. Catalanotto LF 101 760 140 10 0 3 1.000 2 1 3 4 13.2
1986 George Bell LF 147 1297 268 17 10 1 .966 1 6 5 5 13.1
1987 George Bell LF 148 1267 249 15 11 2 .960 0 8 2 5 11.8
2006 Reed Johnson LF 100 635 129 7 1 0 .993 0 1 4 2 11.0
1992 Candy Maldonado LF 129 1123 257 12 7 1 .975 0 6 2 4 10.7
1983 Dave Collins LF 111 827 239 8 3 1 .988 0 2 3 3 9.7
1985 George Bell LF 157 1375 318 13 11 3 .968 2 5 1 6 9.5
1984 Dave Collins LF 106 882 196 8 2 3 .990 0 4 2 2 9.1
1981 Al Woods LF 77 663 180 6 5 0 .974 0 3 1 2 9.0
1979 Al Woods LF 127 1059 250 9 9 2 .966 0 7 2 0 8.5
2007 Adam Lind LF 80 651 137 5 0 0 1.000 0 3 1 1 7.7
1996 Joe Carter LF 115 935 165 7 7 1 .961 1 2 2 2 7.5
1977 Al Woods LF 107 871 206 6 7 1 .968 1 2 2 1 6.9
2005 Reed Johnson LF 118 590 134 4 1 0 .993 0 2 1 1 6.8
1980 Al Woods LF 88 756 206 5 3 1 .986 0 3 0 2 6.6
1995 Joe Carter LF 116 943 226 6 7 1 .971 1 2 2 1 6.4
1988 George Bell LF 149 1271 251 8 15 1 .945 0 2 1 5 6.3
2001 Shannon Stewart LF 142 1216 257 7 5 0 .981 0 4 2 1 5.8
2005 F. Catalanotto LF 111 761 163 4 0 0 1.000 0 2 0 2 5.3
2000 Shannon Stewart LF 136 1171 299 6 2 2 .993 0 3 1 2 5.1
2007 Reed Johnson LF 70 503 108 2 0 0 1.000 0 1 0 1 4.0
1998 Shannon Stewart LF 110 843 207 3 5 0 .977 0 0 2 1 3.6
2002 Shannon Stewart LF 99 861 190 3 2 1 .990 0 1 0 2 3.5
1989 George Bell LF 134 1188 257 4 10 1 .963 0 1 1 2 3.4
1990 George Bell LF 106 922 224 3 5 1 .978 0 3 0 0 3.3
1982 Barry Bonnell LF 98 624 157 2 2 0 .988 0 1 1 0 3.2
1999 Shannon Stewart LF 140 1207 244 3 5 1 .980 1 0 1 1 2.5
1978 Rick Bosetti CF 135 1187 415 16 6 1 .986 1 2 8 5 13.5
1979 Rick Bosetti CF 162 1386 463 18 13 4 .974 0 11 5 2 13.0
1983 Lloyd Moseby CF 147 1221 399 11 7 1 .983 0 5 4 2 9.0
2005 Vernon Wells CF 155 1358 351 12 0 4 1.000 2 3 0 7 8.8
1995 Devon White CF 99 862 261 7 3 0 .989 0 3 3 1 8.1
2002 Vernon Wells CF 146 1240 358 10 2 1 .995 0 3 4 3 8.1
1999 Jose Cruz CF 97 787 248 6 3 1 .988 1 1 2 2 7.6
1998 Jose Cruz CF 103 871 239 6 4 1 .984 1 1 1 3 6.9
1992 Devon White CF 152 1307 443 9 7 2 .985 0 6 1 2 6.9
1984 Lloyd Moseby CF 155 1355 470 8 4 2 .992 0 3 1 4 5.9
1981 Lloyd Moseby CF 80 687 224 4 4 0 .983 0 2 1 1 5.8
1991 Devon White CF 156 1384 439 8 1 2 .998 0 0 6 2 5.8
2000 Jose Cruz CF 162 1423 407 8 3 1 .993 1 2 3 2 5.6
1987 Lloyd Moseby CF 153 1311 294 7 6 1 .980 1 3 2 1 5.3
1985 Lloyd Moseby CF 152 1326 391 7 8 1 .980 0 3 1 3 5.3
1993 Devon White CF 145 1265 399 6 3 2 .993 1 2 1 2 4.7
1986 Lloyd Moseby CF 147 1292 371 6 6 1 .984 0 3 1 2 4.6
1996 Otis Nixon CF 125 1079 342 5 2 2 .994 1 1 3 0 4.6
2004 Vernon Wells CF 131 1135 327 5 1 0 .997 0 2 1 2 4.4
2001 Jose Cruz CF 133 1168 270 5 3 1 .989 0 2 2 1 4.3
1990 Mookie Wilson CF 133 1170 351 5 3 2 .992 0 2 1 2 4.3
2007 Vernon Wells CF 148 1279 321 5 3 0 .991 0 2 1 2 3.9
1994 Devon White CF 98 812 267 3 6 1 .978 1 1 0 1 3.7
1982 Lloyd Moseby CF 145 1163 358 4 2 0 .995 0 2 2 0 3.4
2006 Vernon Wells CF 150 1290 332 4 4 3 .988 1 1 1 1 3.1
1989 Lloyd Moseby CF 120 1051 284 3 4 1 .986 1 1 1 0 2.9
2003 Vernon Wells CF 161 1416 381 3 4 0 .990 0 2 1 0 2.1
1988 Lloyd Moseby CF 117 968 278 2 5 1 .982 1 1 0 0 2.1
1997 Otis Nixon CF 102 892 253 1 1 0 .996 0 0 1 0 1.1
1983 Jesse Barfield RF 118 873 212 17 8 4 .966 1 5 3 8 19.5
1979 Bob Bailor RF 113 850 197 15 3 2 .986 0 5 4 6 17.6
1985 Jesse Barfield RF 147 1290 328 21 4 7 .989 1 6 5 9 16.3
1984 Jesse Barfield RF 79 648 177 10 9 5 .954 4 3 2 1 15.4
1982 Jesse Barfield RF 136 973 216 14 9 4 .962 1 2 3 8 14.4
1991 Joe Carter RF 101 871 191 12 3 2 .985 2 4 2 4 13.8
2001 Raul Mondesi RF 149 1318 263 18 8 2 .972 0 8 3 7 13.7
1986 Jesse Barfield RF 147 1297 335 17 3 7 .992 1 7 4 5 13.1
1987 Jesse Barfield RF 153 1250 313 16 3 3 .991 1 6 1 8 12.8
1997 Orlando Merced RF 96 827 190 10 3 4 .985 3 4 1 2 12.1
1998 Shawn Green RF 128 1080 235 13 6 4 .976 3 4 3 3 12.0
2004 Alexis Rios RF 108 943 217 11 2 4 .991 0 2 1 8 11.7
1980 Lloyd Moseby RF 84 709 168 8 3 0 .983 1 4 0 3 11.3
1995 Shawn Green RF 109 867 209 9 6 3 .973 0 3 2 4 10.4
1978 Bob Bailor RF 102 874 229 9 7 3 .971 1 3 5 0 10.3
1996 Shawn Green RF 127 991 254 10 2 3 .992 0 5 2 3 10.1
1989 Junior Felix RF 86 701 186 7 7 0 .965 0 4 1 2 10.0
1992 Joe Carter RF 123 1044 247 10 8 2 .970 1 4 4 1 9.6
1988 Jesse Barfield RF 132 1053 294 9 4 4 .987 1 5 1 2 8.5
1990 Junior Felix RF 99 860 184 7 9 1 .955 1 3 2 1 8.1
2007 Alexis Rios RF 147 1250 243 10 5 1 .981 0 3 0 7 8.0
1977 Otto Velez RF 78 625 140 5 4 1 .973 1 3 0 1 8.0
2003 Reed Johnson RF 71 532 88 4 3 1 .968 0 2 1 1 7.5
2006 Alexis Rios RF 124 953 218 7 1 2 .996 1 2 3 1 7.3
1993 Joe Carter RF 96 825 183 6 4 0 .979 0 2 3 1 7.3
2005 Alexis Rios RF 138 1056 245 7 2 1 .992 0 2 2 3 6.6
2000 Raul Mondesi RF 96 831 202 5 7 2 .967 2 2 1 0 6.0
1994 Joe Carter RF 110 945 202 4 2 1 .990 0 3 1 0 4.2
1984 George Bell RF 90 717 168 3 5 1 .972 0 0 1 2 4.2
1999 Shawn Green RF 152 1333 341 5 1 1 .997 1 3 1 0 3.8
