


First a reminder: you calculate a Game Score this way:
Start with 50 points.
Add 1 point for each out recorded.
Add 2 points for each inning completed after the 4th.
Add 1 point for each strikeout.
Subtract 2 points for each hit allowed.
Subtract 4 points for each earned run allowed.
Subtract 2 points for each unearned run allowed.
Subtract 1 point for each walk.
Bill James designed the Game Score so that the "average" start would score at about 50. It didn't quite work out that way, as the average Game Score proved to be a little lower than 50 even in 1988. As offense has increased over the past two decades, the average Game Score has declined accordingly - but 50 is still reasonably close to the middle. The Blue Jays Average Game Score in 2005 was 49.8, and the Blue Jays rotation was certainly above-average - the starters ranked 14th in the majors with a 4.20 ERA, despite working in the DH league (where they ranked 6th).
A Game Score of 50 and above is almost always a Quality Start. The Jays had 85 games that score higher than 50, and 79 of them were Quality Starts (the exceptions are almost all starters who came out before completing the sixth). Likewise, a Game Score below 50 is usually not a Quality Start. Toronto had 77 such games, and there were just 5 Quality Starts among them. The worst game among them is Josh Towers' 6-2 loss to the Yankees on August 7 - he gave up 10 hits and 5 runs, and the Game Score was 38. It's still a Quality Start because he went 6 innings and gave up just three earned runs. Call it a Cheap Quality Start.
Cheap Wins are more common, of course, and Lilly (twice) and Chacin got credit for winning games that were even worse.
If we go by Games Scores, the Blue Jays were involved in the two best pitched games in the majors this season. The best of all was Chris Carpenter's one-hit shutout of Toronto on June 14, in which he struck out 10 and walked just one. Next in line, and best in the AL, was Roy Halladay's two-hit shutout of the Twins on May 29 (10 strikeouts, no walks.). Six other NL games scored at 90 or better -another two from Carpenter, as well as outings from John Patterson, Tom Glavine, Pedro Martinez, Jake Peavy, and Derek Lowe. Rich Harden had the only other AL game checking in at 90 or better.
So, obviously Toronto has had 1 start this year that scored 90 or better. Here's the overall distribution:
GS	Games	Pitcher's Team  Pitchers
                Record    Record
90+	 1	 1-0	   1-0	Halladay (1)
80-89	 2	 2-0	   2-0	Halladay (2)
70-79	16	13-1	  15-1	Halladay (4), Towers (4), Chacin (3), Bush (2), Lilly (2),
                                Downs (1)
60-69	31	17-6	  18-13	Bush (7), Halladay (6), Towers (5), Chacin (6), Lilly (4),
                                Downs (2), McGowan (1)
50-59	35	17-8	  22-13	Towers (10), Chacin (9), Lilly (4), Bush (4), Downs (4),
                                Walker (2), Halladay (2)
40-49	30	7-13	   9-21	Chacin (8), Towers (5), Lilly (4), Bush (5), McGowan (3),
                                Downs (5), Halladay (1), Gaudin (1)
30-39	27	3-14	   9-18	Lilly (6), Chacin (5), Towers (4), Halladay (3), Bush (3),
                                Downs (3), Walker (2),  McGowan (1)
20-29	14	0-10	   4-10	Lilly (5), Towers (3), Chacin (3), Bush (1), McGowan (1),
                                Gaudin (1)
10-19	 5	0-4	   0-5	Towers (2), Bush (2), Gaudin (1)
 0-9	 1	0-1	   0-1	McGowan (1)
First, let's note the obvious. You would expect that the team's record would be worse than the starter's record in well-pitched games. This is because when these games are lost, it's almost always the bullpen that loses them. And likewise, the team's record should be better than the starter's record in badly-pitched games. Either the starter couldn't go five, or the team had to rally and win it for the bullpen. These two opposing tendencies meet somewhere in the 40-49 range of Game Starts.Games that score at 60 or better are outstanding pitching performances. It's not at all surprising that the Jays starter who is most likely to give you one of these High Quality outings is Roy Halladay, who throws these games two times out of three - 68% (13 out of 19 starts). And after him comes... Dave Bush?
Yes, indeed, Dave Bush. Bush delivered that level of start almost two times in five (9 of 24, 38%). It makes intuitive sense, to me anyway, that a young pitcher capable of throwing a lot of high-quality games just might have more upside than other pitchers who don't hit the same heights as often, even if their overall performance has been more impressive. Obviously Gustavo Chacin had a much better season than Dave Bush. But Bush actually pitched just as many really good games as Chacin and Josh Towers (who both had 9 60+ games as well), and Bush did it in significantly fewer starts.
If that's surprising, the fact that Bush went 3-4 in those 9 games isn't at all surprising to anyone who's observed his season.
However, if we just look at each regular starter’s five best games, we have another surprise in store:
TOTALS		G  W  L   IP    H   R  ER  HR  BB  SO  ERA	Avg GS
Chacin		5  5  0  35.2  21   2   1   0  10  24 0.25	70.6
Halladay	5  4  0  45.0  22   3   3   1   3  40 0.60	83.2
Towers		5  4  0  41.0  28   4   3   0   2  20 0.66	72.6
Bush		5  1  3  37.1  25   4   4   1   5  21 0.96	69.2
Lilly		5  4  1  34.0  22   5   5   1   9  37 1.32	68.8
Downs		5  2  2  31.0  23   9   7   3   8  31 2.03	62.0
When Gustavo Chacin was sharp, he was very sharp indeed. He didn't go as deep into the game as Halladay, but hey - no one does.
Doc's no-decision, by the way, was that memorable affair against Tampa in June, when he hooked up with Scott Kazmir in a game that was both thrilling - Gabe Gross threw out the winning run at home plate in the bottom of the tenth - and infuriating - John McDonald kept hitting into double plays to kill rallies. The Jays finally won in 11 innings (when that same McDonald beat out an infield hit!) Doc had a Game Score of 75, best of any starter in a no-decision.
Towers' no-decision (Game Score 69) was also against Tampa - that was the Travis Lee Game
And if Dave Bush was a little frustrated from time to time this past season, the line above (1-3, 0.96 !!) is a pretty good reason why. However, his no-decision (Game Score 71) was almost yet another loss. It came in that amazing 18 inning game against the Angels - Bush left trailing 1-0 in the ninth, but his team rallied to tie, and the two teams then played another entire ball game before the home side finally prevailed.
Well, we might as well look at the grotesque half of the equation – here are the five worst starts from the same crew:
TOTALS		G  W  L   IP    H   R  ER  HR  BB  SO   ERA  Avg GS
Halladay	5  0  3  29.0  41  23  22   7   4  20   6.83   39.2
Downs		5  1  1  21.2  32  19  18   3  10  16   7.48   36.8
Chacin		5  1  1  22.1  41  25  25   4   8  14  10.07   28.4
Towers		5  0  5  20.2  45  29  27   7   5   8  11.76   23.4
Bush		5  0  2  19.0  35  27  27   4   7   9  12.79   24.4
Lilly		5  0  4  14.2  28  27  27   6  13  10  16.57   24.6
Yikes. Let's not dwell on that, OK? Instead, we'll have another look at the six main starters, complete with some Pretty Pictures. This just tracks each starters Game Scores throughout the season:
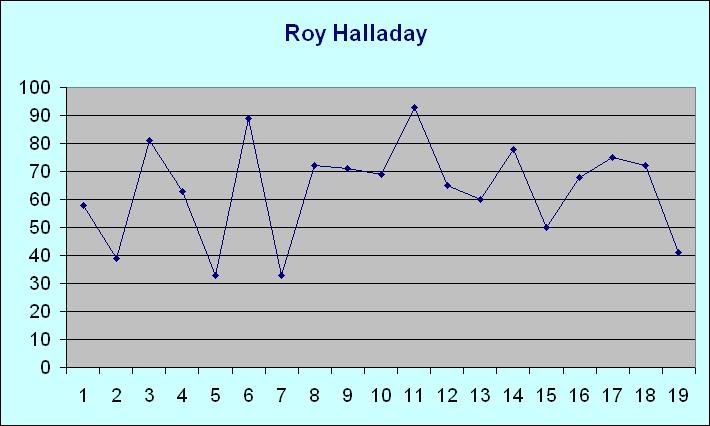
Roy "Doc" Halladay:
Average Game Score: 63.7
Median Game Score: 68
Cheap Wins: 0
Cheapest Win: Apr. 4 at TB – 7 IP, 9 H, 2 R, 2 ER, 0 W, 7 K. Game Score: 58 (Wow. That's his worst win?)
Tough Losses: 2
Toughest Loss: June 8 at Chi. (NL) – 7 IP, 7 H, 2 R, 2 ER, 0 W, 5 K, Game Score: 60
Blown Saves in Games Started: 2
Average Pitches per Start: 100.7
Highest pitch count: 124 (May 24 at Cle.)
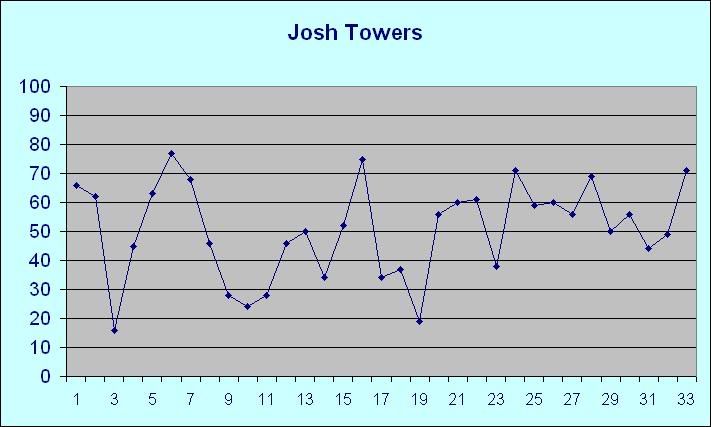
Josh "Control" Towers:
Average Game Score: 50.3
Median Game Score: 52
Cheap Wins: 2
Cheapest Win: Sep. 20 vs Sea. – 6 IP, 8 H, 4 R, 1 ER, 2 W, 0 K. Game Score: 44
Tough Losses: 4
Toughest Loss: Aug. 28 vs Cle. – 7 IP, 5 H, 4 R, 3 ER, 1 W, 4 K. Game Score: 56
Blown Saves in Games Started: 5
Average Pitches per Start: 89.6
Highest pitch count: 108 (May 9 vs KC)
Gustavo "Cha-Cha" Chacin:
Average Game Score: 50.2
Median Game Score: 51
Cheap Wins: 1
Cheapest Win: Jul. 15 vs TB – 5.1 IP, 9 H, 5 R, 5 ER, 0 W, 3 K. Game Score: 33
Tough Losses: 1
Toughest Loss: Sep. 17 vs NY – 7 IP, 8 H, 1 R, 1 ER, 1 W, 4 K. Game Score: 60
Blown Saves in Games Started: 3
Average Pitches per Start: 95.4
Highest pitch count: 116 (Jun.1 at Sea.)
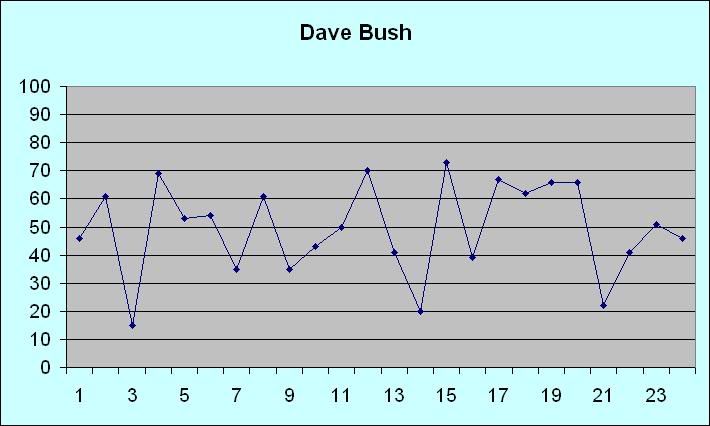
Dave "Why Me?" Bush:
Average Game Score: 49.1
Median Game Score: 51
Cheap Wins: 1
Cheapest Win: Aug.3 at Chi. (AL) – 5 IP, 7 H, 3 R, 3 ER, 1 W, 1 K. Game Score: 41
Tough Losses: 4
Toughest Loss: Aug. 13 at Bal. – 8 IP, 4 H, 1 R, 1 ER, 0 W, 3 K. Game Score: 73
Blown Saves in Games Started: 4
Average Pitches per Start: 87.5
Highest pitch count: 107 (Apr. 23 vs Bal.)
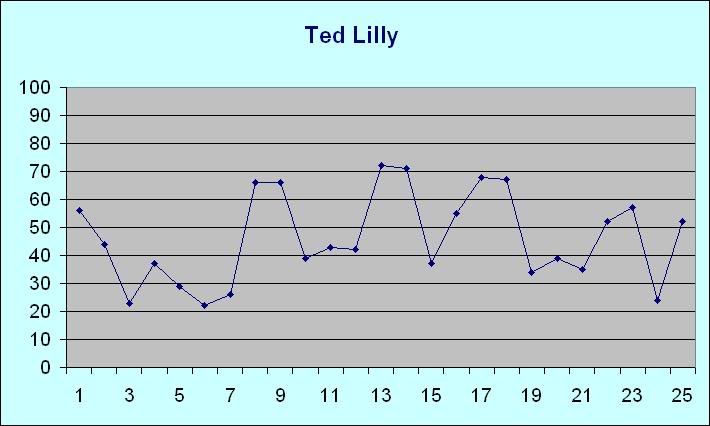
Ted "The Tease" Lilly:
Average Game Score: 46.0
Median Game Score: 43
Cheap Wins: 2
Cheapest Win: Jul. 19 vs Sea. – 5.1 IP, 7 H, 5 R, 5 ER, 3 W, 4 K. Game Score: 35
Tough Losses: 1
Toughest Loss: Jul. 14 vs TB – 7 IP, 4 H, 2 R, 2 ER, 2 W, 8 K. Game Score: 67
Blown Saves in Games Started: 1
Average Pitches per Start: 85.6
Highest pitch count: 108 (Sep. 28 at Bos.)
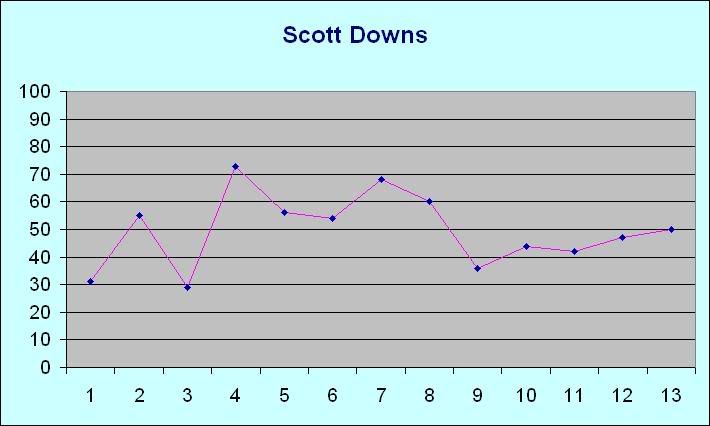
Scott "System of a" Downs:
Average Game Score: 49.5
Median Game Score: 50
Cheap Wins: 2
Cheapest Win: Sep. 13 vs Bos. – 5.1 IP, 6 H, 3 R, 3 ER, 1 W, 2 K. Game Score: 45
Tough Losses: 2
Toughest Loss: Jul. 29 vs Tex. – 5 IP, 5 H, 2 R, 2 ER, 2 W, 8 K. Game Score: 55
Blown Saves in Games Started: 3
Average Pitches per Start: 90.1
Highest pitch count: 100 (Aug.22 at NY and Sep. 24 at NY)
(Note: Not all of the Blown Saves cited above would have been victories for the starter. Although all five of the saves blown behind Towers cost him a win.)
Gustavo Chacin’s victory over Tampa Bay was the Cheapest Win posted by any starter; Dave Bush’s 1-0 defeat by the Orioles was the Toughest Loss.
Gustavo Chacin walked the most batters in a single game, issuing 6 free passes to the Yankees on August 5.
Scott Downs, of all people, had the biggest strikeout game when he fanned 11 Tampa Bay hitters on September 2. Halladay and Lilly both had 10 K games.
Josh Towers gave up the most hits in a game, setting a new team record when he allowed 14 hits to Minnesota on May 27.
Dustin McGowan was hammered for 12 runs (10 earned) in his disastrous start against Detroit on August 21. It was the only time a Toronto starter allowed more than 7 runs in a game.
Ted Lilly (twice) and Chad Gaudin both allowed 3 home runs in a start.
Only once all season did Gibbons have a starter throw more than 120 pitches - Halladay was locked up in a duel with C.C. Sabathia until the Jays broke it open with 3 runs in the eighth. The fewest number of pitches thrown by a starter was 40, by Josh Towers in his ugly April 17 start against Texas.
Finally, here is the biggest Data Table of them all: it's just the lines from all 162 game starts. So that you too can amuse yourselves at your leisure. The earlier version posted with my Game Report back on September 24 simply listed the games chronologically – this time I’ll sort them in descending order, by Game Score:
DATE	Starter   OPP  RESULT  IP   H   R ER HR BB SO	PIT	BF	GSc	DEC

May. 29	Halladay  MIN  W 4-0   9    2   0  0  0  0 10	 99	30	93	W(8-2)
Apr. 29	Halladay @NYY  W 2-0   9    3   0  0  0  1  9	115	32	89	W(4-1)
Apr. 14	Halladay @TEX  W 2-1   9    5   1  1  0  1  9	118	33	81	W(2-0)
Apr. 16	Chacin   @TEX  W 8-0   8    2   0  0  0  2  3	107	28	79	W(3-0)
Jun. 13	Halladay  STL  W 4-1   9    5   1  1  1  0  5	101	32	78	W(10-3)
May. 3	Towers	 @BAL  W 1-0   8    3   0  0  0  1  2	 92	25	77	W(3-1)
Jun. 28	Halladay  @TB  W 3-1   9    7   1  1  0  1  7	113	34	75	-
Jun. 29	Towers	  @TB  W 12-3  7    2   1  1  0  1  7	 89	25	75	W(6-7)
Aug. 11	Downs	  DET  W 2-1   7    2   1  1  1  0  4	 89	23	73	W(1-2)
Aug. 13	Bush	 @BAL  L 1-0   8    4   1  1  0  0  3	 95	30	73	L(2-6)
May. 10	Halladay   KC  W 3-1   9    8   1  1  1  0  5	 97	32	72	W(5-2)
Jun. 6	Chacin	 @CHC  W 4-1   7    5   0  0  0  1  6	 97	27	72	W(6-4)
Jun. 15	Lilly	  STL  W 5-2   7    4   0  0  0  3  6	 97	26	72	W(4-7)
Jul. 3	Halladay @BOS  W 5-2   8    5   1  1  0  2  6	101	30	72	W(12-4)
Jul. 26	Chacin	  LAA  W 8-0   8    6   0  0  0  2  4	 95	29	72	W(10-5)
Jun. 20	Lilly	  BAL  W 11-2  7    3   2  2  1  2 10	103	26	71	W(5-7)
Jul. 28	Bush	  LAA  W 2-1   8.1  5   1  1  0  2  4	106	32	71	-
Aug. 12	Towers	 @BAL  W 12-0  9    9   0  0  0  0  2	 98	33	71	W(9-9)
Sep. 30	Towers	  KC   W 10-1  9    9   1  1  0  0  6	 94	34	71	W(13-12)
Apr. 23	Bush	  BAL  L 4-1   8    5   1  1  1  1  2	107	31	69	L(0-3)
May. 21	Halladay  WAS  W 7-0   7    4   0  0  0  2  2	 98	26	69	W(7-2)
Sep. 3	Towers	   TB  L 3-2   8    5   2  1  0  0  3	 81	30	69	-
May. 9	Towers	   KC  W 6-1   8    7   1  1  0  1  5	108	31	68	W(4-1)
May. 15	Halladay @CLE  W 5-2   7.2  5   1  1  0  3  6	124	30	68	W(6-2)
Jun. 23	Halladay  BAL  W 6-2   8    7   2  2  0  0  8	 98	31	68	W(11-4)
Jul. 6	Lilly	  OAK  W 8-0   7    6   0  0  0  2  5	101	27	68	W(7-8)
Aug. 27	Downs	  CLE  W 2-1   6    3   1  0  0  2  6	 99	23	68	W(2-3)
Jul. 14	Lilly	   TB  L 3-0   7    4   2  2  0  2  8	101	28	67	L(7-9)
Aug. 24	Bush	 @NYY  W 9-5   6    5   0  0  0  2  7	106	25	67	W(3-7)
Apr. 6	Towers	  @TB  L 8-5   6    4   1  1  1  0  6	 86	22	66	-
May. 20	Lilly	  WAS  W 6-1   6    5   1  1  0  0  8	 89	24	66	W(2-4)
Sep. 4	Bush	   TB  L 1-0   7    6   1  1  0  0  5	 98	28	66	L(4-8)
Sep. 10	Bush	  @TB  W 3-2   8    4   2  2  1  3  3	103	30	66	W(5-8)
Jun. 3	Halladay @OAK  W 6-2   7    6   1  1  0  2  6	106	27	65	W(9-2)
Jul. 31	Chacin	  TEX  W 5-1   6.1  4   1  0  0  4  6	115	27	65	W(11-5)
Sep. 5	Chacin	 @BAL  W 6-2   6.1  4   1  1  0  1  5	 88	24	65	W(12-8)
Sep. 11	Chacin	  @TB  L 6-5   8.2  5   3  2  0  1  7	105	28	65	-
Apr. 19	Halladay @BOS  W 4-3   8    4   3  3  2  2  3	101	30	63	W(3-0)
May. 25	Lilly	  BOS  W 6-1   7.2  4   1  1  0  3  4	102	28	63	W(3-4)
Jul. 30	McGowan	  TEX  L 3-2   5    2   1  1  0  3  6	 91	21	62	-
Aug. 30	Bush	  BAL  W 7-2   7    7   2  2  1  0  7	 96	27	62	W(4-7)
Apr. 13	Bush	 @OAK  L 6-3   7    5   2  2  1  1  3	103	25	61	-
May. 18	Bush	 @MIN  L 3-2   8    7   3  3  2  0  5	106	30	61	L(0-4)
Oct. 2	Chacin	   KC  W 7-2   7.2  7   2  1  1  1  3	104	30	61	W(13-9)
Apr. 28	Towers	   TB  W 7-4   7.2  6   3  1  0  0  6	100	27	60	W(2-1)
Jun. 8	Halladay @CHC  L 2-0   7    7   2  2  0  0  5	 98	28	60	L(9-3)
Aug. 20	Chacin	 @DET  L 3-2   7    5   2  2  2  1  2	 90	25	60	-
Aug. 23	Towers	 @NYY  L 5-4   7    6   2  2  0  0  3	 71	25	60	-
Sep. 2	Downs	   TB  W 4-3   7    7   3  3  1  2 11	 98	29	60	-
Sep. 17	Chacin	  NYY  L 1-0   7    8   1  1  0  1  4	 95	28	60	L(12-9)
Apr. 5	Chacin	  @TB  W 6-3   5    3   1  1  1  1  3	 73	19	59	W(1-0)
Apr. 12	Towers	 @OAK  W 5-2   7.2  6   2  2  0  1  6	100	27	59	W(1-0)
Apr. 4	Halladay  @TB  W 5-2   7    9   2  2  0  0  7	 91	29	58	W(1-0)
Apr. 27	Chacin	   TB  W 8-2   8.2  7   2  2  0  2  3	113	32	58	W(4-1)
Jul. 17	Walker	   TB  L 5-4   6    6   1  1  1  0  2	 83	24	58	-
Aug. 2	Towers	 @CWS  W 7-3   8.2  8   3  3  1  0  7	105	32	58	W(8-8)
Sep. 18	Lilly	  NYY  W 6-5   6.1  5   3  2  1  1  6	102	25	58	W(9-10)
Jul. 20	Chacin	  SEA  W 9-4   6    6   1  1  1  1  2	110	25	57	W(9-5)
Jul. 27	Towers	  LAA  W 3-2   7.2  6   2  1  1  1  2	 99	27	57	-
Apr. 10	Lilly	  BOS  W 4-3   5    6   1  1  0  1  6	 82	22	56	-
May. 26	Chacin	  BOS  W 8-1   6    7   1  0  0  2  2	 91	26	56	W(5-3)
Jul. 21	Towers	  SEA  W 6-3   7    5   3  3  0  0  1	 96	27	56	W(7-8)
Aug. 17	Towers	 @LAA  W 4-1   7.2  7   1  1  0  1  1	 80	27	56	W(10-9)
Aug. 28	Towers	  CLE  L 4-1   7    5   4  3  2  1  4	101	27	56	L(10-10)
Sep. 14	Towers	  BOS  L 5-3   8    7   5  3  2  1  5	104	31	56	L(11-11)
Jul. 1	Lilly	 @BOS  W 15-2  6    7   1  1  1  2  3	100	26	55	W(6-8)
Jul. 29	Downs	  TEX  L 4-1   5    5   2  2  1  2  8	 87	22	55	L(0-2)
May. 6	Bush	  CWS  L 5-3   5    5   2  1  0  1  4	 79	20	54	-
Jul. 7	Chacin	  OAK  W 4-2   6.2  5   2  2  1  1  4	 98	22	54	W(7-5)
Aug. 22	Downs	 @NYY  L 7-0   6    6   2  1  0  2  2	100	27	54	L(1-3)
Apr. 30	Bush	 @NYY  L 4-3   7    8   3  3  1  0  4	107	28	53	-
May. 2	Chacin	 @BAL  W 6-2   7.1  7   2  2  0  5  2	107	32	53	-
Jun. 11	Chacin	 @HOU  L 6-3   6    7   2  2  0  2  5	100	26	53	-
Jun. 22	Walker	  BAL  W 3-2   5.1  5   2  2  1  0  3	 75	22	53	W(3-0)
Aug. 16	Downs	 @LAA  W 4-3   7.2  6   3  3  0  3  6	 98	28	53	-
Jun. 24	Towers	 @WAS  L 3-0   6    8   2  2  0  1  5	 93	27	52	L(5-7)
Sep. 28	Lilly	 @BOS  W 7-2   6.2  6   2  2  1  5  3	108	30	52	W(10-11)
Apr. 11	Chacin	 @OAK  W 10-3  6    8   2  2  1  1  4	100	26	51	W(2-0)
Aug. 10	Chacin	  DET  W 4-3   7.2  5   3  3  2  4  3	101	29	51	-
Sep. 27 Bush	 @BOS  L 1-3   6    6   3  3  0  2  5	105	27	51	L(5-11)
Jun. 12	Towers	 @HOU  L 3-0   7    9   3  2  1  2  3	 97	31	50	L(5-5)
Jun. 18	Halladay  MIL  L 5-2   6    7   4  4  1	 0  8	105	27	50	L(10-4)
Jul. 23	Bush	  @KC  W 9-4   7    8   3  3  0  1  2	 99	28	50	W(1-5)
Sep. 9	Towers	  @TB  W 7-2   6    9   2  2  0  1  5	 90	27	50	W(11-10)
Sep. 29	Downs	 @BOS  L 4-5   5    5   2  2  0  2  3	 96	21	50
May. 31	Gaudin	 @SEA  W 9-7   5    7   2  2  0  2  6	 93	24	49	W(1-0)
Jun. 1	Chacin	 @SEA  L 3-0   8.2 10   3  3  0  3  5	116	32	49	L(5-4)
Aug. 15	Chacin	 @LAA  L 5-4   6    6   3  3  0  3  4	102	28	49	-
Sep. 12	Lilly	  BOS  L 6-5   6.2  5   3  3  2  1  3	104	23	49	-
Sep. 25	Towers	 @NYY  L 4-8   7    7   4  4  1  1  3	 88	28	49	L(12-12)
Apr. 21	Chacin	  NYY  L 4-3   6    6   4  4  0  2  5	109	26	47	L(3-1)
Jun. 7	Towers	 @CHC  W 6-4   5.1  5   3  3  1  2  3	 78	23	47	-
Sep. 24	Downs	 @NYY  W 7-4   5.2  5   4  3  1  2  4	100	27	47	W(4-3)
Apr. 8	Bush	  BOS  L 6-5   5    4   3  3  2  2  1	 84	20	46	L(0-1)
May. 17	Towers	 @MIN  W 10-3  5    7   2  2  1  1  2	 84	21	46	W(5-1)
Oct. 1	Bush	   KC  L 6-7   5    5   3  3  1  0  1	 86	21	46
Apr. 22	Towers	  BAL  L 13-5  6    8   4  4  2  0  5	 80	24	45	-
Jun. 26	Chacin	 @WAS  W 9-5   5.1  5   3  3  1  3  2	104	24	45	-
Aug. 31	Chacin	  BAL  L 7-0   7    7   5  5  2  2  4	 84	28	45	L(11-8)
Sep. 13	Downs	  BOS  W 9-3   5.1  6   3  3  1  1  2	 96	22	45	W(3-3)
Apr. 15	Lilly	 @TEX  L 4-2   5    5   3  3  1  4  3	 90	23	44	L(0-1)
Aug. 9	McGowan	  DET  W 6-4   6.1  8   4  4  0  1  4	 90	26	44	W(1-0)
Sep. 20	Towers	  SEA  W 6-4   6    8   4  1  2  2  0	 99	27	44	W(12-11)
May. 14	Chacin	 @CLE  L 3-2   2.1  2   2  2  0  3  1	 51	12	43	-
Jun. 4	Lilly	 @OAK  L 5-2   6    6   4  4  1  3  2	107	27	43	L(3-6)
Jun. 10	Lilly	 @HOU  L 4-2   6    7   4  4  3  1  1	 86	26	42	L(3-7)
Jun. 21	Chacin	  BAL  L 9-5   5    5   6  1  1  2  1	 85	24	42	L(6-5)
Aug. 4	McGowan	 @CWS  L 5-4   5    4   4  4  1  3  2	 95	21	42	-
Aug. 5	Chacin	  NYY  L 6-2   5    6   3  3  1  6  5	 97	25	42	L(11-6)
Sep. 19	Downs	  SEA  L 7-5   5    7   3  3  1  1  2	 92	24	42	-
Sep. 21	Bush	  SEA  L 3-2   3.1  3   3  3  0  3  3	 78	17	42	L(5-10)
Aug. 3	Bush	 @CWS  W 4-3   5    7   3  3  2  1  1	 78	23	41	W(2-5)
May. 28	Bush	  MIN  L 4-3   5.2  6   4  2  2  1  1	 77	21	40	L(0-5)
Jul. 8	Halladay @TEX  L 7-6   3.2  6   3  2  2  0  4	 48	15	40	-
Aug. 26	McGowan	  CLE  L 9-3   5    8   4  4  2  1  6	 88	25	40	L(1-2)
Apr. 9	Halladay  BOS  W 12-5  6    7   5  5  1  1  2	 94	25	39	-
May. 19	Chacin	 @MIN  L 4-0   5    7   4  4  0  2  4	105	25	39	L(4-3)
Jun. 27	Walker	  @TB  L 4-3   6    7   4  4  2  3  0	 81	27	39	L(3-1)
Jul. 24	Lilly	  @KC  L 6-5   4    5   4  4  1  0  3	 74	17	39	-
Aug. 7	Towers	  NYY  L 6-2   6   10   5  3  1  2  4	 91	29	38	L(8-9)
Aug. 19	Bush	 @DET  L 9-5   3.2  5   4  2  2  1  3	 44	15	38	L(2-7)
Sep. 1	McGowan	  BAL  L 5-3   5.1  7   4  4  2  2  2	 92	25	38	L(1-3)
Apr. 26	Lilly	   TB  W 7-5   6    9   5  5  2  1  4	 85	27	37	W(1-2)
May. 8	Chacin	  CWS  L 5-4   6    9   5  5  2  2  5	104	28	37	L(4-2)
Jun. 25	Lilly	 @WAS  L 5-2   4    4   4  4  0  3  2	 76	19	37	L(5-8)
Jul. 2	Chacin	 @BOS  L 6-4   5    8   4  4  0  1  3	 85	24	37	-
Jul. 10	Towers	 @TEX  L 9-8   6    9   5  5  0  1  4	 91	28	37	-
Sep. 7	Downs	 @BAL  W 7-4   4.1  7   4  3  0  4  6	 86	24	37	-
May. 30	Lilly	 @SEA  L 4-3   5.2  6   4  4  1  3  3	 65	23	36	L(3-5)
Sep. 6	Lilly	 @BAL  L 5-0   2.1  3   3  3  0  5  2	 63	15	36	L(8-10)
May. 24	Bush	  BOS  W 9-6   3    5   3  3  0  2  0	 54	13	35	-
Jun. 19	Towers	  MIL  L 5-2   5.1  9   4  4  0  1  2	 95	25	35	L(5-6)
Jul. 19	Lilly	  SEA  W 12-10 5.1  7   5  5  2  3  4	 96	26	35	W(8-9)
May. 4	Halladay @BAL  L 5-1   7.1 12   5  5  1  2  2	113	33	34	L(4-2)
May. 11	Bush	   KC  W 12-9  4.2  7   4  4  0  0  3	 74	18	34	-
Jul. 5	Towers	  OAK  L 10-7  4    8   3  3  1  2  2	 81	22	34	-
Apr. 24	Halladay  BAL  L 7-1   6    9   6  6  2  1  4	 94	29	33	L(3-1)
Jul. 15	Chacin	   TB  W 11-6  5.1  9   5  5  2  0  3	 92	26	33	W(8-5)
Jun. 17	Chacin	  MIL  W 9-5   2.1  6   4  4  0  1  3	 58	14	31	-
Jul. 22	Walker	  @KC  L 5-3   3.1  4   5  5  0  3  2	 66	18	31	L(3-3)
Jul. 9	Downs	 @TEX  L 12-10 3.2  4   5  5  1  1  1	 51	13	30	L(0-1)
Aug. 6	Downs	  NYY  W 8-5   3.1  8   4  4  0  3  5	 79	21	30	-
May. 1	Lilly	 @NYY  W 8-6   5    8   6  6  1  2  4	 84	24	29	-
May. 22	Towers	  WAS  L 9-2   4.1  7   5  5  0  1  1	 70	21	29	L(5-2)
Jun. 2	Towers	 @OAK  L 5-3   4.1  6   5  5  1  4  2	 87	23	29	L(5-4)
Aug. 14	McGowan	 @BAL  W 7-6   3.1  6   4  4  0  4  1	 73	19	29	-
Aug. 25	Chacin	 @NYY  L 6-2   6.2  9   6  6  2  3  5	112	29	29	L(11-7)
Sep. 22	Chacin	  SEA  W 7-5   4.1  7   5  5  0  4  3	 92	23	28	-
Jun. 14	Gaudin	  STL  L 7-0   4.1 10   5  5  3  1  4	 86	24	26	L(1-2)
May. 13	Lilly	 @CLE  L 6-4   2.2  3   5  5  0  5  1	 67	13	25	L(1-4)
Apr. 20	Lilly	  NYY  L 11-2  3.1  6   6  6  0  2  2	 54	18	24	L(0-2)
May. 27	Towers	  MIN  L 7-2   6   14   7  5  2  0  4	104	34	24	L(5-3)
Sep. 23	Lilly	 @NYY  L 0-5   1    5   4  4  2  3  0	 50	27	24	L(9-11)
May. 7	Lilly	  CWS  L 10-7  2.2  6   6  6  3  1  3	 54	12	21	L(1-3)
Sep. 16	Bush	  NYY  L 11-10 3.2  6   6  6  2  2  1	 63	17	21	L(5-9)
Sep. 27 Chacin	 @BOS  W 7-5   3.2 10   5  5  0  0  0	 60	21	21
Jul. 16	Towers	   TB  L 6-5   4   10   6  6  2  0  1	 84	22	19	L(6-8)
Aug. 8	Bush	  DET  L 9-8   5.2 10   7  7  1  1  2	 83	24	17	-
Apr. 17	Towers	 @TEX  L 6-5   2    8   6  6  2  0  0	 40	14	16	L(1-1)
Apr. 18	Bush	 @BOS  L 12-7  2    7   7  7  1  2  3	 69	15	15	L(0-2)
Jun. 5	Gaudin	 @OAK  L 12-4  1    7   7  7  1  1  1	 48	11	11	L(1-1)
Aug. 21	McGowan	 @DET  L 17-6  4.1  9  12 10  2  2  2	 95	28	1	L(1-1)
