


Baseball season, kids! That was summer in the air this afternoon! Feel the excitement! Catch the taste!
I am far more energized by the prospect than a man of my years and dignity ought to be, and there's a real danger of me hurting myself. I can't quite figure out why - it's certainly not this year's edition of the hometown team. Here at the Box we've been sorting out some sort of semi-organized Division of Labour, with something resembling a plan. I myself have undertaken to produce, for your viewing pleasure, a piece to appear every Monday that will (or will not, depending on how the mood strikes me) look at the week ahead (or the week behind, or the infield fly rule, or whatever.)
So eager am (let's see how long this lasts - I am older than dirt, after all) - that our inaugural installment appears now, a day early!
I do have an ulterior motive. I find myself suddenly beavering away at no less than three unrelated Large Pieces of Research/Investigations/Bits of Gossip (as well as poking around the edges of the next installments of the Lobby of Numbers.) There's a piece of research I did on the Use of the Relief Ace, which basically simply needs to be converted from spreadsheet to text - it was really just an exercise in assembling information. Just a bunch of formatting, and it's done. There is to be, at long last, another edition of The Year in Review - we'll be going over 1951 this time (which means I'm getting uncomfortably close to a period when I was actually walking the earth. Was I actually walking during the 1950s? I may have been, near the end, there.)
And, finally, the topic closest to my heart, and the one that brings me forth to call on you today.
One-Run Games. What else?
See, I'm doing this study on One-Run Games, covering the period from the Dawn of Time to the present day. And something came up. It seems quite natural to me that there would be a relationship between the number of runs being scored per game and the number of one-run games in a season. So I'd like to track that relationship and present it in a form even I can grasp at a glance - in other words, a graphic.
My ambition here is savagely constrained by my somewhat limited Excel skills - I can barely manage the production of one kind of graph, a line graph like the ones I have utilized from time to time. Such a thing should actually be sufficient to suit my purpose.
But here's where it gets complicated. The relationship between scoring and one-run games is likely to be an inverse relationship - as one rises, the other falls. The graphic won't show two lines moving together in harmony, which is what the actual import ought to be.
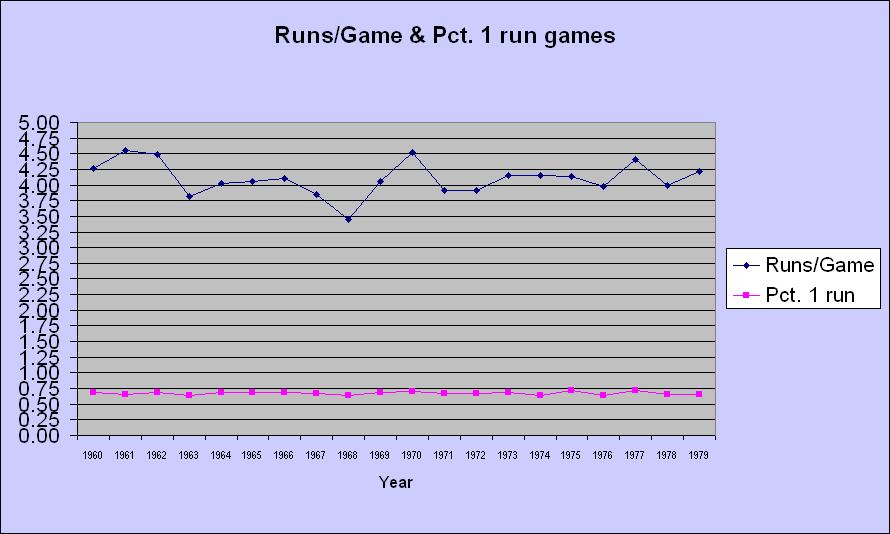
Well, that's addressed easily enough. We track the the number of runs per game along with the number of games decided by more than one run. It's the same principle, and while it does seem a bit ass-backward, it'll get the job done and convey the point. But there's still a problem: one of my lines is moving between a range of, oh 3.5 to 7.0 - while the other line is moving in percentages of 1 - from maybe .45. to .80
Like this, which is pretty darn useless, if you ask me:
So here's my solution. I will set a baseline for each of the numbers I'm tracking. I'll use the historical average of runs per game since 1893 (4.7) and the historical percentage of games decided by more than one run (it's .696 - since the dawn of time, just over 30% of all baseball games have been one run games.) So 4.7 and .696 are my two baselines, each represents 1.00, and my yearly figures for both categories are presented as a percentage of that baseline figure. And that gives us:
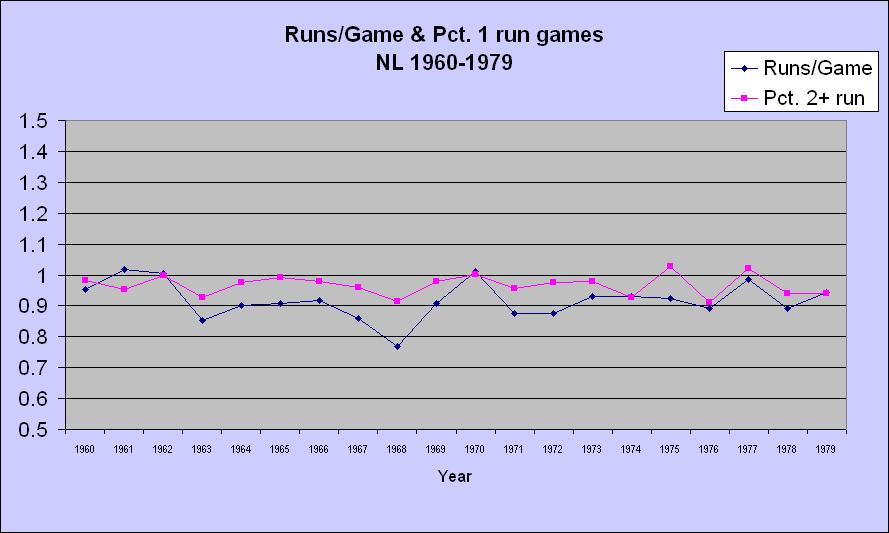
Now this, I hope, is useful - you can see the actual movement between the two sets of numbers (which during this period aren't linked nearly as closely as one might expect, but more anon.)
Anyway, my question to one and all - does all this make sense? Can it be followed by anyone not caught up in whatever madness now possesses me? Is there another way? One within my limited skill set?
Now, as for the week ahead..
PLAY BALL!
I am far more energized by the prospect than a man of my years and dignity ought to be, and there's a real danger of me hurting myself. I can't quite figure out why - it's certainly not this year's edition of the hometown team. Here at the Box we've been sorting out some sort of semi-organized Division of Labour, with something resembling a plan. I myself have undertaken to produce, for your viewing pleasure, a piece to appear every Monday that will (or will not, depending on how the mood strikes me) look at the week ahead (or the week behind, or the infield fly rule, or whatever.)
So eager am (let's see how long this lasts - I am older than dirt, after all) - that our inaugural installment appears now, a day early!
I do have an ulterior motive. I find myself suddenly beavering away at no less than three unrelated Large Pieces of Research/Investigations/Bits of Gossip (as well as poking around the edges of the next installments of the Lobby of Numbers.) There's a piece of research I did on the Use of the Relief Ace, which basically simply needs to be converted from spreadsheet to text - it was really just an exercise in assembling information. Just a bunch of formatting, and it's done. There is to be, at long last, another edition of The Year in Review - we'll be going over 1951 this time (which means I'm getting uncomfortably close to a period when I was actually walking the earth. Was I actually walking during the 1950s? I may have been, near the end, there.)
And, finally, the topic closest to my heart, and the one that brings me forth to call on you today.
One-Run Games. What else?
See, I'm doing this study on One-Run Games, covering the period from the Dawn of Time to the present day. And something came up. It seems quite natural to me that there would be a relationship between the number of runs being scored per game and the number of one-run games in a season. So I'd like to track that relationship and present it in a form even I can grasp at a glance - in other words, a graphic.
My ambition here is savagely constrained by my somewhat limited Excel skills - I can barely manage the production of one kind of graph, a line graph like the ones I have utilized from time to time. Such a thing should actually be sufficient to suit my purpose.
But here's where it gets complicated. The relationship between scoring and one-run games is likely to be an inverse relationship - as one rises, the other falls. The graphic won't show two lines moving together in harmony, which is what the actual import ought to be.
Well, that's addressed easily enough. We track the the number of runs per game along with the number of games decided by more than one run. It's the same principle, and while it does seem a bit ass-backward, it'll get the job done and convey the point. But there's still a problem: one of my lines is moving between a range of, oh 3.5 to 7.0 - while the other line is moving in percentages of 1 - from maybe .45. to .80
Like this, which is pretty darn useless, if you ask me:
So here's my solution. I will set a baseline for each of the numbers I'm tracking. I'll use the historical average of runs per game since 1893 (4.7) and the historical percentage of games decided by more than one run (it's .696 - since the dawn of time, just over 30% of all baseball games have been one run games.) So 4.7 and .696 are my two baselines, each represents 1.00, and my yearly figures for both categories are presented as a percentage of that baseline figure. And that gives us:
Now this, I hope, is useful - you can see the actual movement between the two sets of numbers (which during this period aren't linked nearly as closely as one might expect, but more anon.)
Anyway, my question to one and all - does all this make sense? Can it be followed by anyone not caught up in whatever madness now possesses me? Is there another way? One within my limited skill set?
Now, as for the week ahead..
PLAY BALL!

