Batter's Box Interactive Magazine Batter's Box Interactive Magazine Batter's Box Interactive Magazine
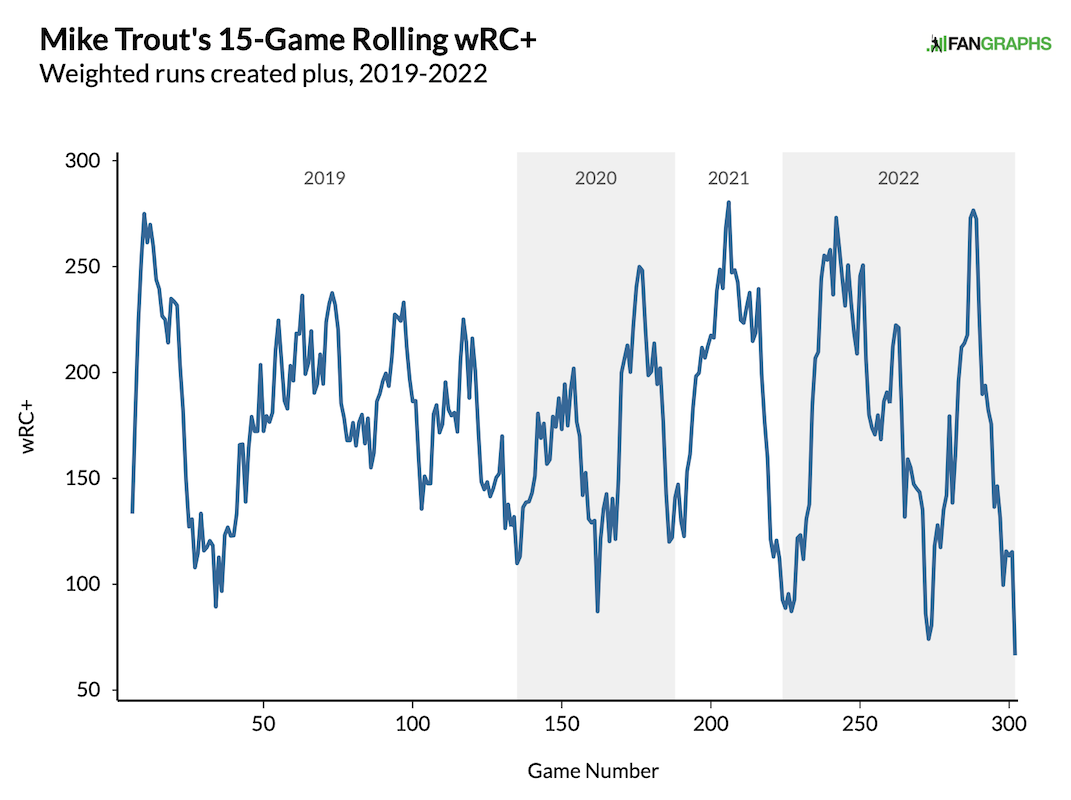
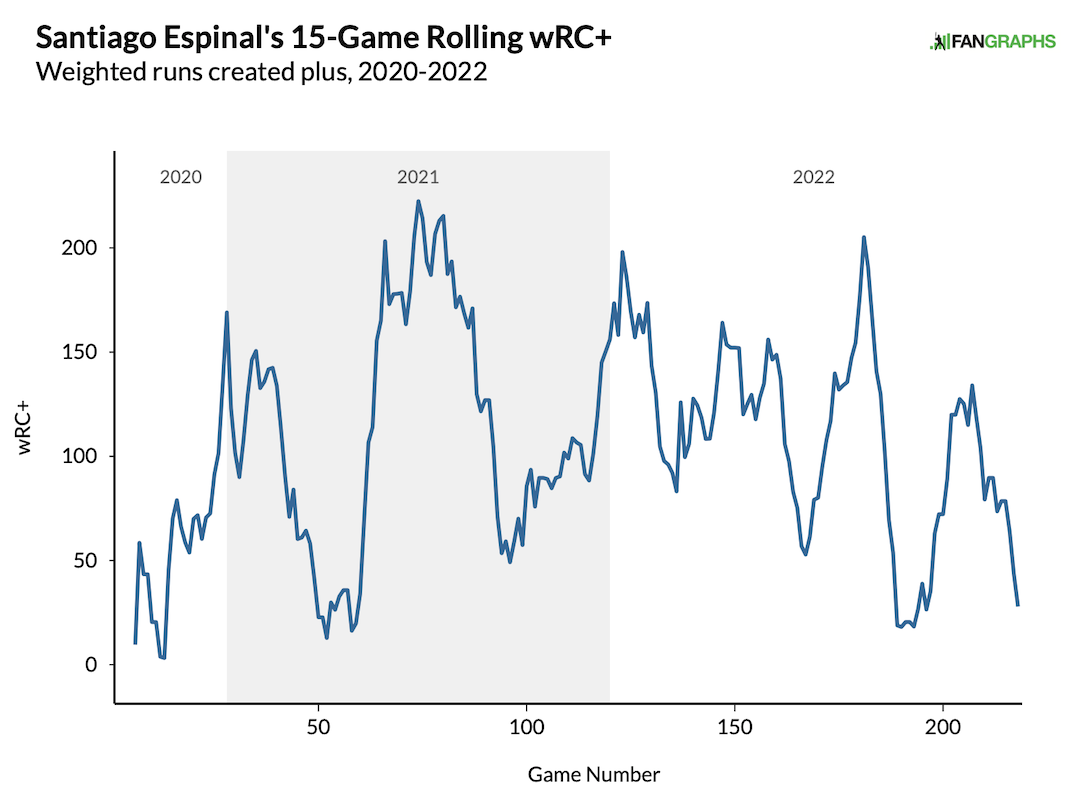
Hitters are streaky. Your favourite slugger seems to go 3-for-5 with a double and a home run every game for a week, and then they'll go hitless for three straight games. This is normal: there are peaks and valleys to everybody's production. What separates a hitter like Mike Trout from a hitter like Santiago Espinal is how cold "cold" gets.

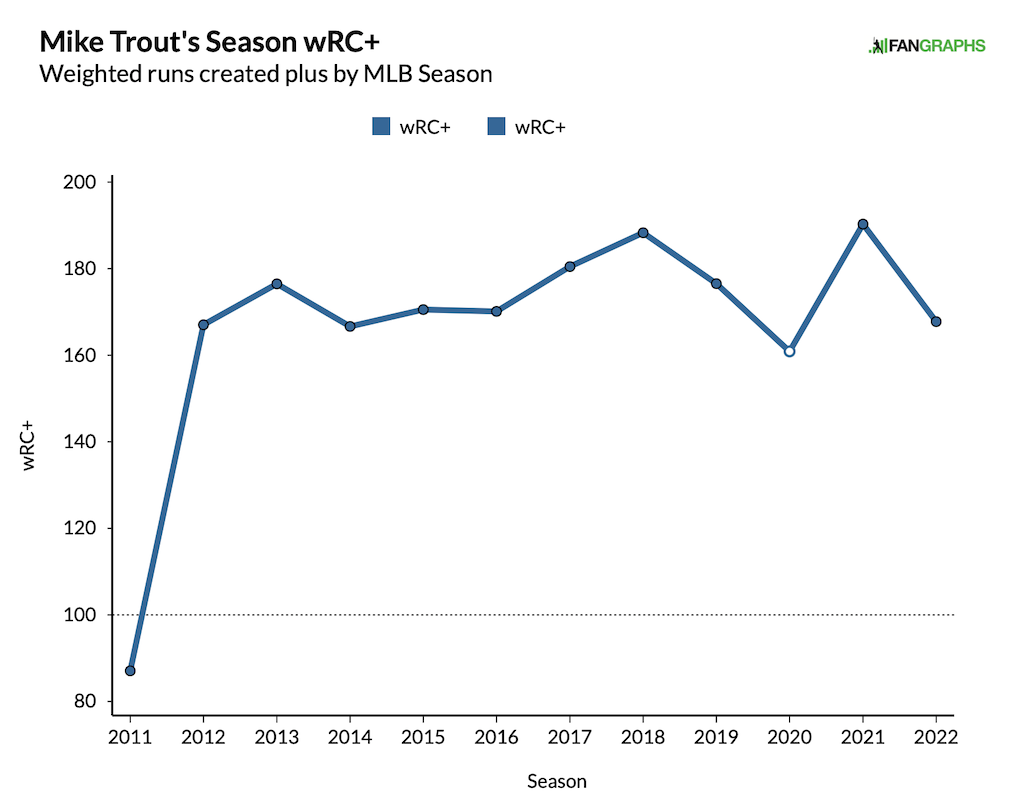
(A brief aside: I use FanGraphs' wRC+ statistic in the rest of this post. It's a complete measure of the total offense created by a player, and it's measured like percentages; a wRC+ of 100 would mean you're a completely league average hitter, a wRC+ of 110 that you're 10% better than average, and a wRC+ of 90 that you're 10% worse at hitting than average.) Mike Trout's production is bonkers. His lowest production over a full season is a wRC+ of 161; that's the equivalent of hitting like Vladdy in 2021 every year for more than a decade while playing centre field. There's a reason that, even if he retired today, he'd be a hall of famer.

But look at that graph measured over 15 games instead of seasons (the "rolling average"): he has massive peaks above 250 wRC+, but sometimes even dips below 100. (FYI: I only included the last few years because the graph is just too chaotic if you've got too much data. You can make your own graphs!)

Over a whole season, that adds up to what we saw earlier: 160-190 wRC+, but there are clearly times when everything's working at the peak of Trout's ability, and there are times when he's "only" as good as an average major leaguer. I look at these graphs for Blue Jays all the time, mostly because I'm trying to see whether certain players are "turning it around," whether there's anything to hope for. I spend a lot of time on Vladdy's graphs especially.

This basically matches up with the eye test, right? In 2020, Vladdy had times when he was pretty good (150 wRC+), and times when he really wasn't; the trailer, not the movie. But last year, he saw some pretty extended streaks at wRC+ of 200, peaking at 250. (That's two, two and a half times as good as the average hitter, adjusted for park.) He got pretty cold in August, around 80 wRC+, and then picked it back up for the end of the year. And yes, it looks like Vladdy's started turning it back on now. And this also helps to validate the eye test for Springer: he really did have an exceptionally hot end of last season and early part of the season, but it feels like his elbow's limiting him to roughly league average production lately, because he's at about 100 wRC+, and his ground ball rate's really spiked.

When Lourdes Gurriel Jr first came to the Jays in 2018, he had an 11-game multi-hit game streak, something that had most recently been accomplished in 1972 by hall of famer Tony Pérez. At some point during that streak I said out loud to my wife, "This kid's going to be a superstar," and I'm on record as being a believer in him back then (I was, uh, way off). When Gurriel's hitting, you can't believe his entire contract is $22 million for 7 years, but his lows make you wonder why the Jays signed him in the first place. Gurriel's come out of his incredibly awful first third of 2022 to start hitting like regular viewers know he can, but he's basically the definition of streaky.

Blue Jays fans were full of schadenfreude after last year's surprise stars for the Jays, Marcus Semien and Robbie Ray, signed elsewhere and were immediately significantly worse than they'd been with the Jays. Well, in the following four months, Semien has really turned things around, with his production at basically exactly the same level as with the Jays, hovering near 150 wRC+.

Robbie Ray has had some good moments in his 2022, but hasn't really been able to recapture the magic of his 2021 yet. Unfortunately, FanGraphs doesn't allow me to graph ERA+, a similar stat to wRC+, so this graph is ERA-, where 100 is still league average, but, like ERA, lower is better. That trough at the end of 2021 is when Ray was pitching about 55% better than the rest of the league. He's now firmly worse than average, with a season ERA- of 110.

Coming back to current Jays, Bo Bichette is having a very feast-or-famine season. He was a monster for the first 2 weeks of June, but his overall season's production has alternated between terrible and just about average, adding up to an overall completely average mark of 99 wRC+ for the season. I don't know what to make of this; Bo's approach is just so aggressive that it's gotta be easy for things to go wrong for him.

Similar to Bo, Espinal's had moments of excellent performance, but the lows have been very low, and he's left with a sub-100 wRC+ season overall.

Espinal (and Biggio, who's on a similar slide recently) obviously made the Jays think they needed an upgrade at second, and one who's able to play centre at the same time helps solve a problem if Springer needs extended time off. Which brings us to brand-new Blue Jay Whit Merrifield, who will assuredly join the Blue Jays in Toronto precisely 14 days after he realized he was going to be playing on a team with a chance to go play in Canada in the postseason. Merrifield had an absolutely putrid start to the season, but has actually been hitting pretty well lately, and that's brought his season line up to a pretty terrible 80 wRC+. He seems to play a competent centre, though, so it'll sure beat Bradley Zimmer's 29 those times that Springer needs the day (or week) off.

When the Jays' hot streaks line up, they're basically unstoppable. Go back to the last game of 2021: Springer, Bichette and Espinal were all really hot at the same time, and Vladdy still hit a home run in that game. When those players are hot at the same time, no team wants to face them.
Taking a Peek at Some Jays, and Also at Some Fondly Remembered Ex-Jays | 8 comments | Create New Account
The following comments are owned by whomever posted them. This site is not responsible for what they say.
John Northey - Thursday, August 04 2022 @ 01:28 AM EDT (#419036) #
Thanks Joe. Fun to look at those charts!
bpoz - Thursday, August 04 2022 @ 08:47 AM EDT (#419040) #
Thanks Joe. I actually may understand some of what the charts are telling. But what exactly is the horizontal line of the chart. It has something to do with years because I see 2019-2022. I think I got it!! 150 is game #150 in that time period. So 150-200 is a 50 game interval.

With Springers injury issues (2021 he only played in 78 games) this means that in those 78 games he was not fully healthy often. Which would produce some injury related poor hitting performances.
uglyone - Thursday, August 04 2022 @ 09:36 AM EDT (#419043) #
Love these charts. They show maybe the most important lesson to learn about baseball and sports in general.

I'm actually surprised to sed Gurriel doesnt se notably streakier than the others. I thiught he was for sure.
bpoz - Thursday, August 04 2022 @ 10:53 AM EDT (#419044) #
If I looked at Gurriel month by month he played in 22 games in April and did not get a hit in 6.

May 22 games no hits in 11 games. Bad month.

June 25 no hits in 5 games.

July 23 (AS break) no hits in 4 games.

Aug played 2 games and hit in both.

Gurriel hit leadoff yesterday.

If my math is wrong it is because I scrolled and added manually.

Joe - Thursday, August 04 2022 @ 11:06 AM EDT (#419045) #
With Springers injury issues (2021 he only played in 78 games) this means that in those 78 games he was not fully healthy often.
IIRC this is 100% true (he hurt his knee too), but there are other reasons that hitters get hot and cold; I'm definitely not a hitting expert person, but it's such a reaction-based, muscle-memory skill that you could easily see people get their timing messed up, "not see the ball well", etc.
Michael - Thursday, August 04 2022 @ 06:20 PM EDT (#419077) #
I think there are 3 conflating things to remember about these rolling 15 game window sorts of things:

1. The performance of the player (which can be a combination of skill/experience/age/health)

2. The quality of opposition

3. Raw luck

Since baseball is played often in 3 and 4 game series against opponents, sometimes home-and-away only a week apart the quality of opponent in each 15 game rolling window is going to change quite a bit (item 2 above). That will have a natural interaction in it. Even if you had someone that was the most consistent 100 wRC+ possible against "league average" quality opponents, they'd still have ups and downs based on were they playing most of their games against the cream of the AL East or the dregs of the AL Central. And did they fact starting pitchers #1-#3 of the opponents or did they catch starters #4,#5, and minor call up, etc.
Joe - Friday, August 05 2022 @ 09:23 AM EDT (#419143) #
Thanks, Michael! That's a good point — there's a certain amount of clustering luck inherent in baseball, and it's hard to account for exactly why a player's going through a hot or cold streak (opponent quality definitely plays a role that I hadn't even thought of!) Meanwhile, Trout's "cold spells" are 100 wRC+. What a machine.
John Northey - Friday, August 05 2022 @ 03:26 PM EDT (#419181) #
Well Joe, you got me curious so I had to check some other guys Stats only for 2002-present so I couldn't do Ted Williams or others who would be interesting (such as John Olerud who seemed consistent but this would show it better).

Barry Bonds..
Bonds Stats
Gotta love that 400 wRC+ level he hit every so often during that video game stat time.  He was full of PED's but dang is it fun to see what happens when a guy who was already HOF level does that - kind of like in a video game when you supercharge a strong character.

For Jays content... Jose Bautista
He did drop to near 50 for some 15 game stretches or even below in 2013, but look at that peak in 2011 - wow, now that is getting hot (non-Bonds division).
Taking a Peek at Some Jays, and Also at Some Fondly Remembered Ex-Jays | 8 comments | Create New Account
The following comments are owned by whomever posted them. This site is not responsible for what they say.